XRP poised for positive breakout as ascending triangle pattern takes over

Bitcoin’s recent price movement has prompted many altcoins to post significant gains on the cryptocurrency charts. XRP has been struggling to keep hold of the key $0.30 level and has been trading below it for a while, despite its peer coins recording upward momentum.
The coin needed a trend reversal to compensate for last week’s decline and XRP was trading at $0.29, at press time.
XRP 6-hour Chart

Source: XRP/USD on TradingView
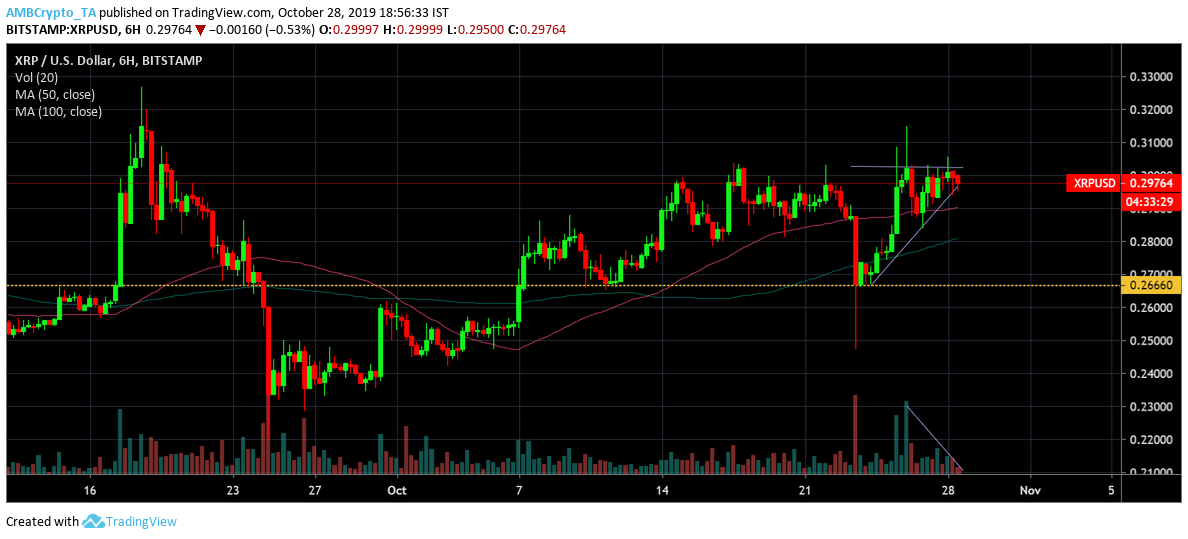
XRP was trading very close to its crucial resistance point at $0.30 and a breakout to the positive side was expected. The 6-hour chart for XRP recorded the formation of an ascending triangle pattern. This was indicative of a bullish breakout in the near-term. The decline in volume over the same time frame provided further validity to the pattern formation.
The 50 moving average, supporting the price candles since 25 October, hovered above the 100 moving average. This further supported a potential upward breakout, following the closure of the ascending channel pattern.
XRP bulls can find a major resistance at $0.34 if a breakout to the upside materializes, a level last seen in July this year. The coin found support at points $0.28 and $0.26, respectively
Bullish projection

Source: XRP/USD on TradingView
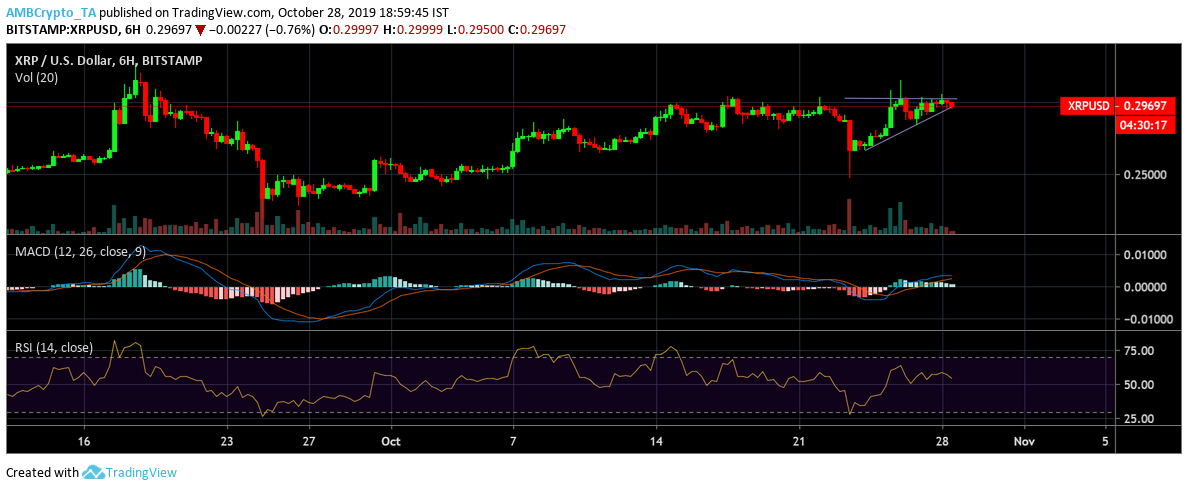
The MACD indicator was bullish on XRP’s near-term price action, with the leading line above the signal line. Additionally, the RSI line was above the 50 median, suggesting positive sentiment among XRP investors.
The medium-term chart for XRP exhibited an overall positive sentiment for the coin’s future. If the trend persists, the coin could potentially tread levels not seen since the crypto-market spiraled down in the last week of September.


