Crypto News
XRP, Dogecoin, Chainlink price analysis: 30 August
XRP was trading near an important zone, above which is possible safety. Failure to close above this level could mean XRP might be in store for a significant drop. Chainlink showed strong bullish momentum that could propel it towards ATH once more. Dogecoin lacked notable momentum but could reclaim a resistance as support in the coming days.
XRP
Source: XRP/USD on TradingView
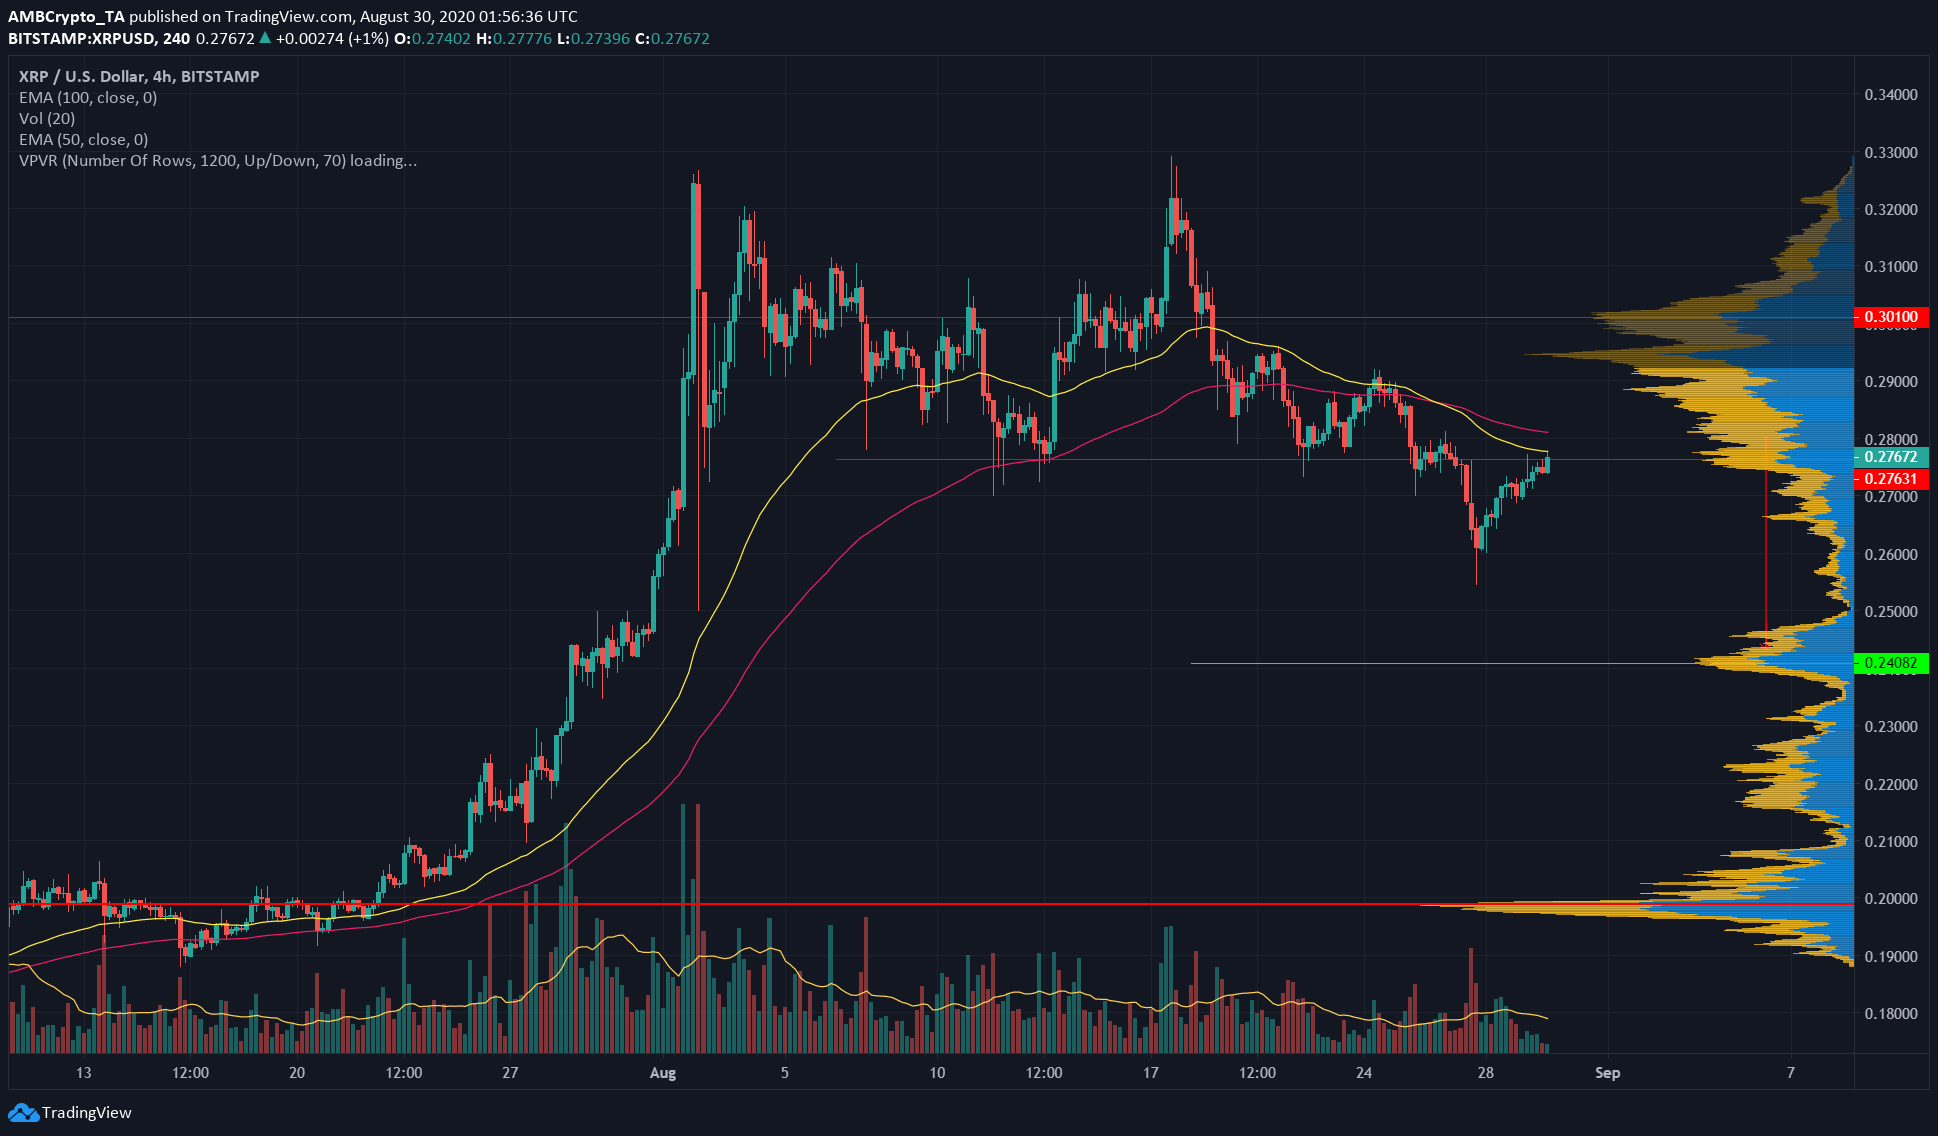
XRP is the third-largest cryptocurrency, with a marketcap of $12.483 billion. Recently, Japanese giant SBI Holdings announced the addition of CFD’s for XRP.
XRP was trading at a level of significance, as highlighted by VPVR. The zone at $0.276 and above has seen significant XRP trading. If XRP does not settle above this level, it could drop to $0.24.
After reaching $0.27, the price increase by $0.006 was achieved. Moreover, 50 EMA (yellow) and the 100 EMA (pink) will act as resistance.
Dogecoin [DOGE]
Source: DOGE/USDT on TradingView
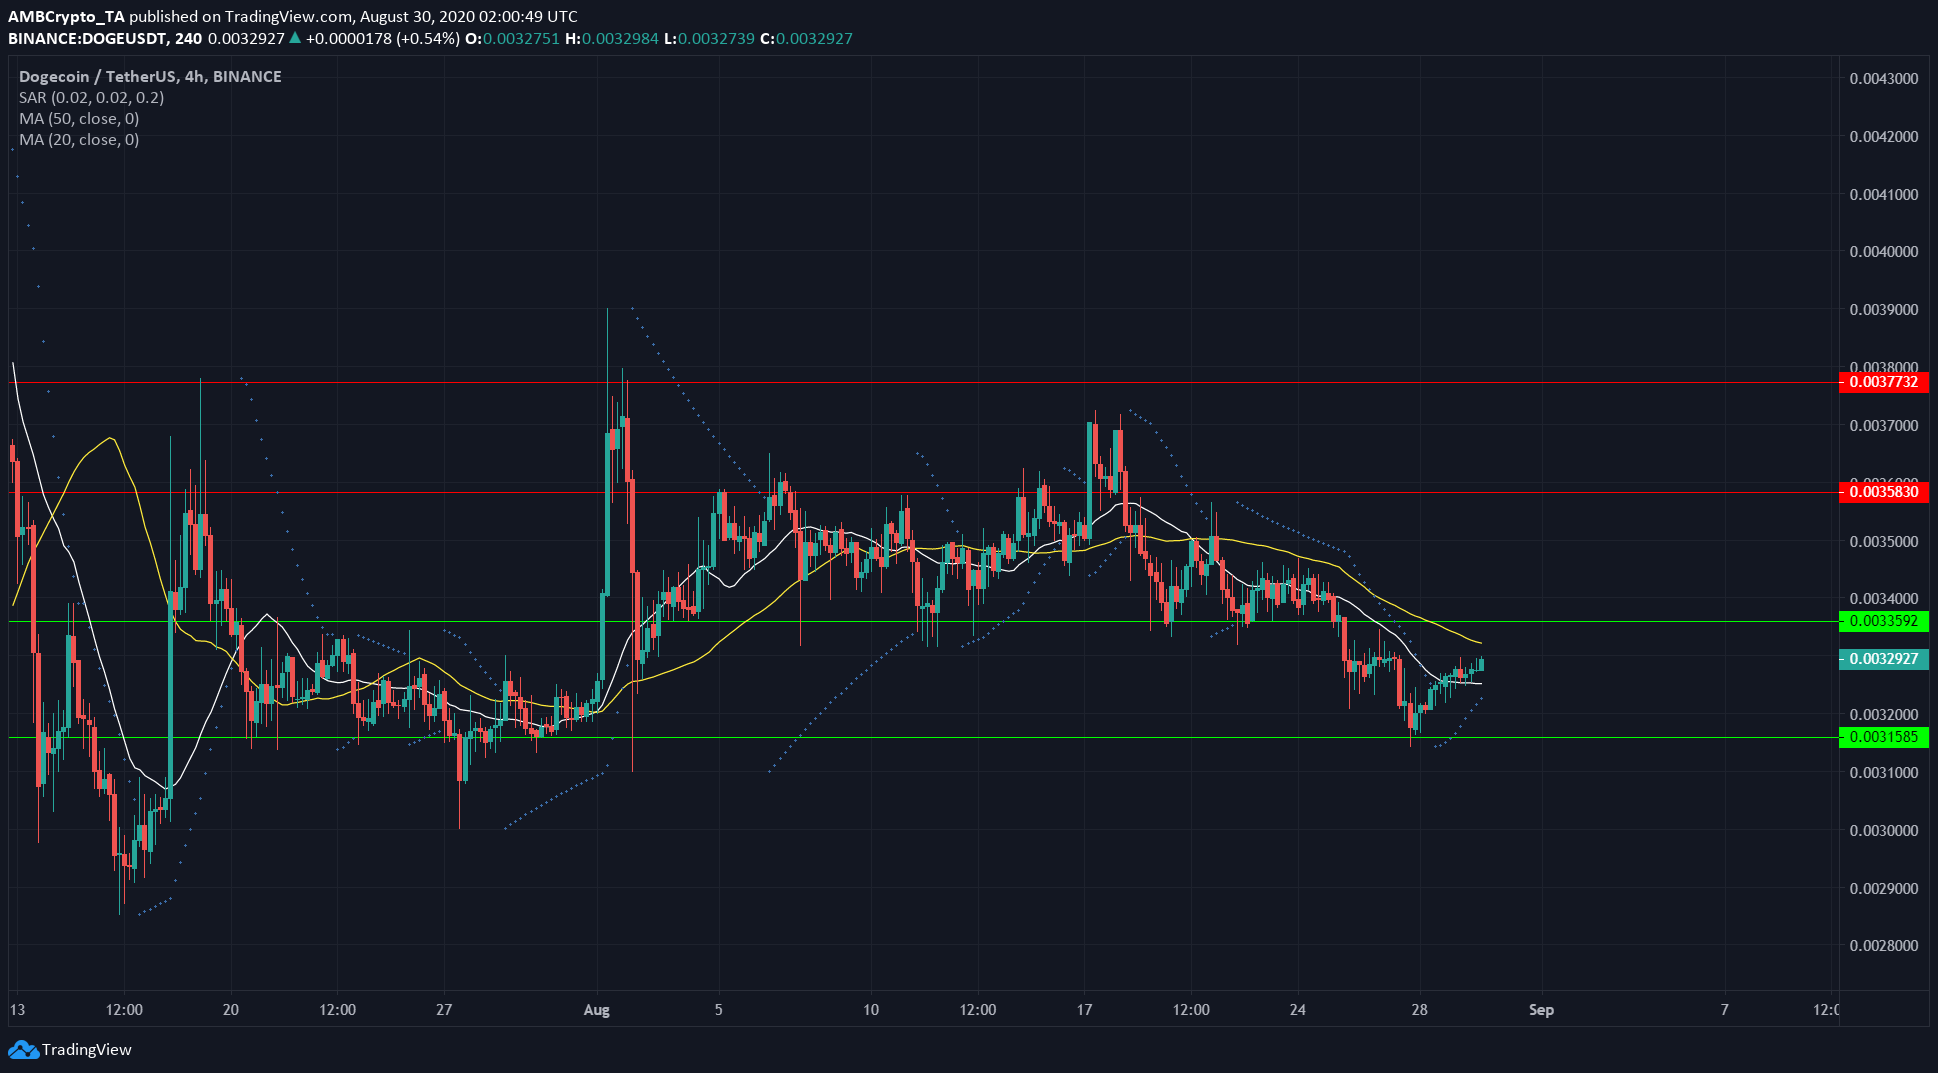
DOGE bounced off support at $0.00311 to trade at $0.00329 at press time. However, 20 SMA (white) was below 50 SMA (yellow), showing short-term bearishness remained. Yet Parabolic SAR dots were beneath the candle and rose quickly, suggesting bullish momentum.
Price could reach resistance at $0.00335, or 50 SMA, and then fail to breach resistance. This would denote a continuation of the bearish trend for the past two weeks.
A breach of resistance will signify an imminent short-term trend reversal.
Chainlink [LINK]
Source: LINK/USD on TradingView
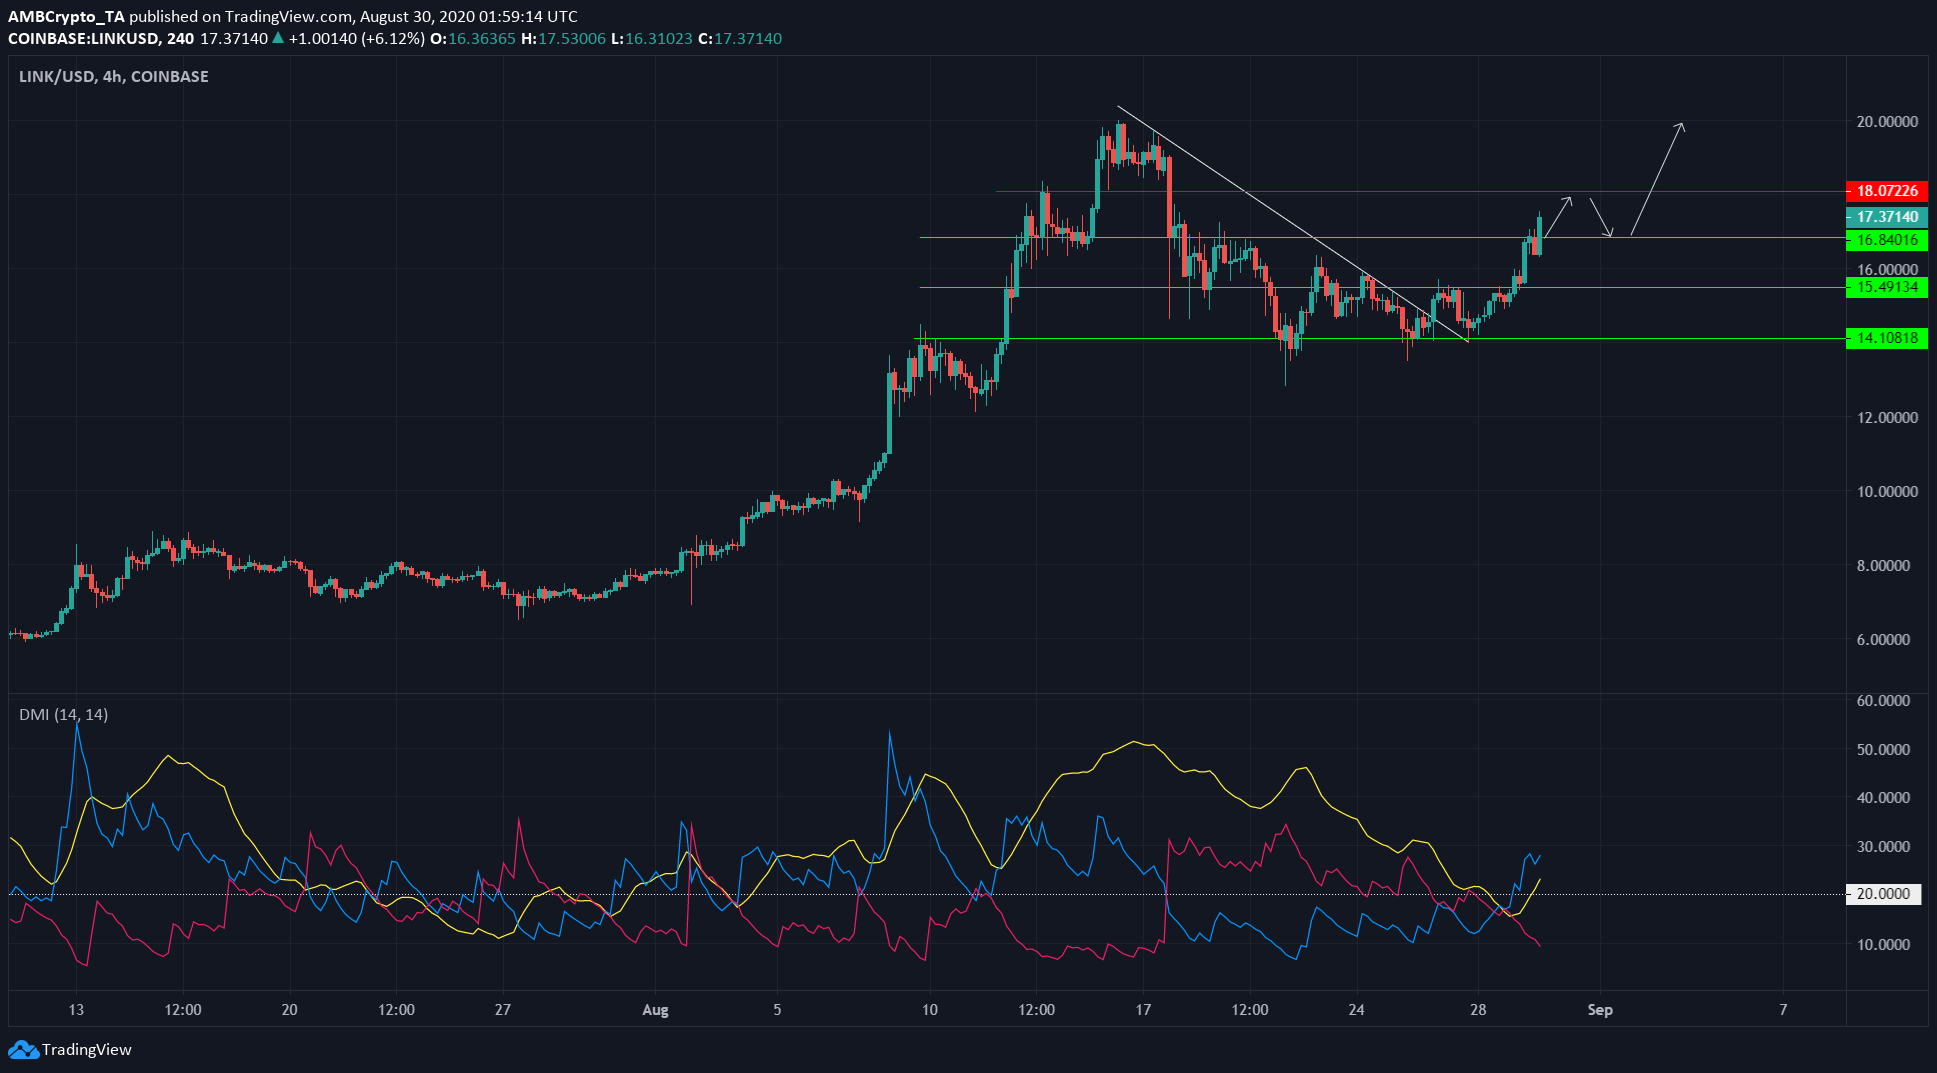
LINK reached ATH at $20 before dropping to $13 and maintained some bearish outlook, as shown by the trendline (white). LINK ascended beyond this trendline retested it, and support stood at $14.1.
$18 is a psychological resistance. It is possible LINK could go past $18, or it may get rejected there to retest $16.8 and make another attempt to breach resistance.
Directional Movement Index (DMI) showed the beginning of a strong bullish trend for LINK in the past few hours. ADX (yellow) was above 20, denoting trend strength. +DMI (blue) was also well above -DMI (pink).