
XRP increased in value from $0.184 to $0.245 in the days between 2nd and 12th of January, marking a whopping ~33% increase in value over less than two weeks. The coin dropped in value since then, to around $0.22 at the time of writing, and could dip further down in the weeks to come. CoinMarketCap data showed XRP currently has a market capitalization of over $9.8 billion, with nearly $2.3 billion worth of XRP traded in the last 24 hours.
XRP 4-hour chart
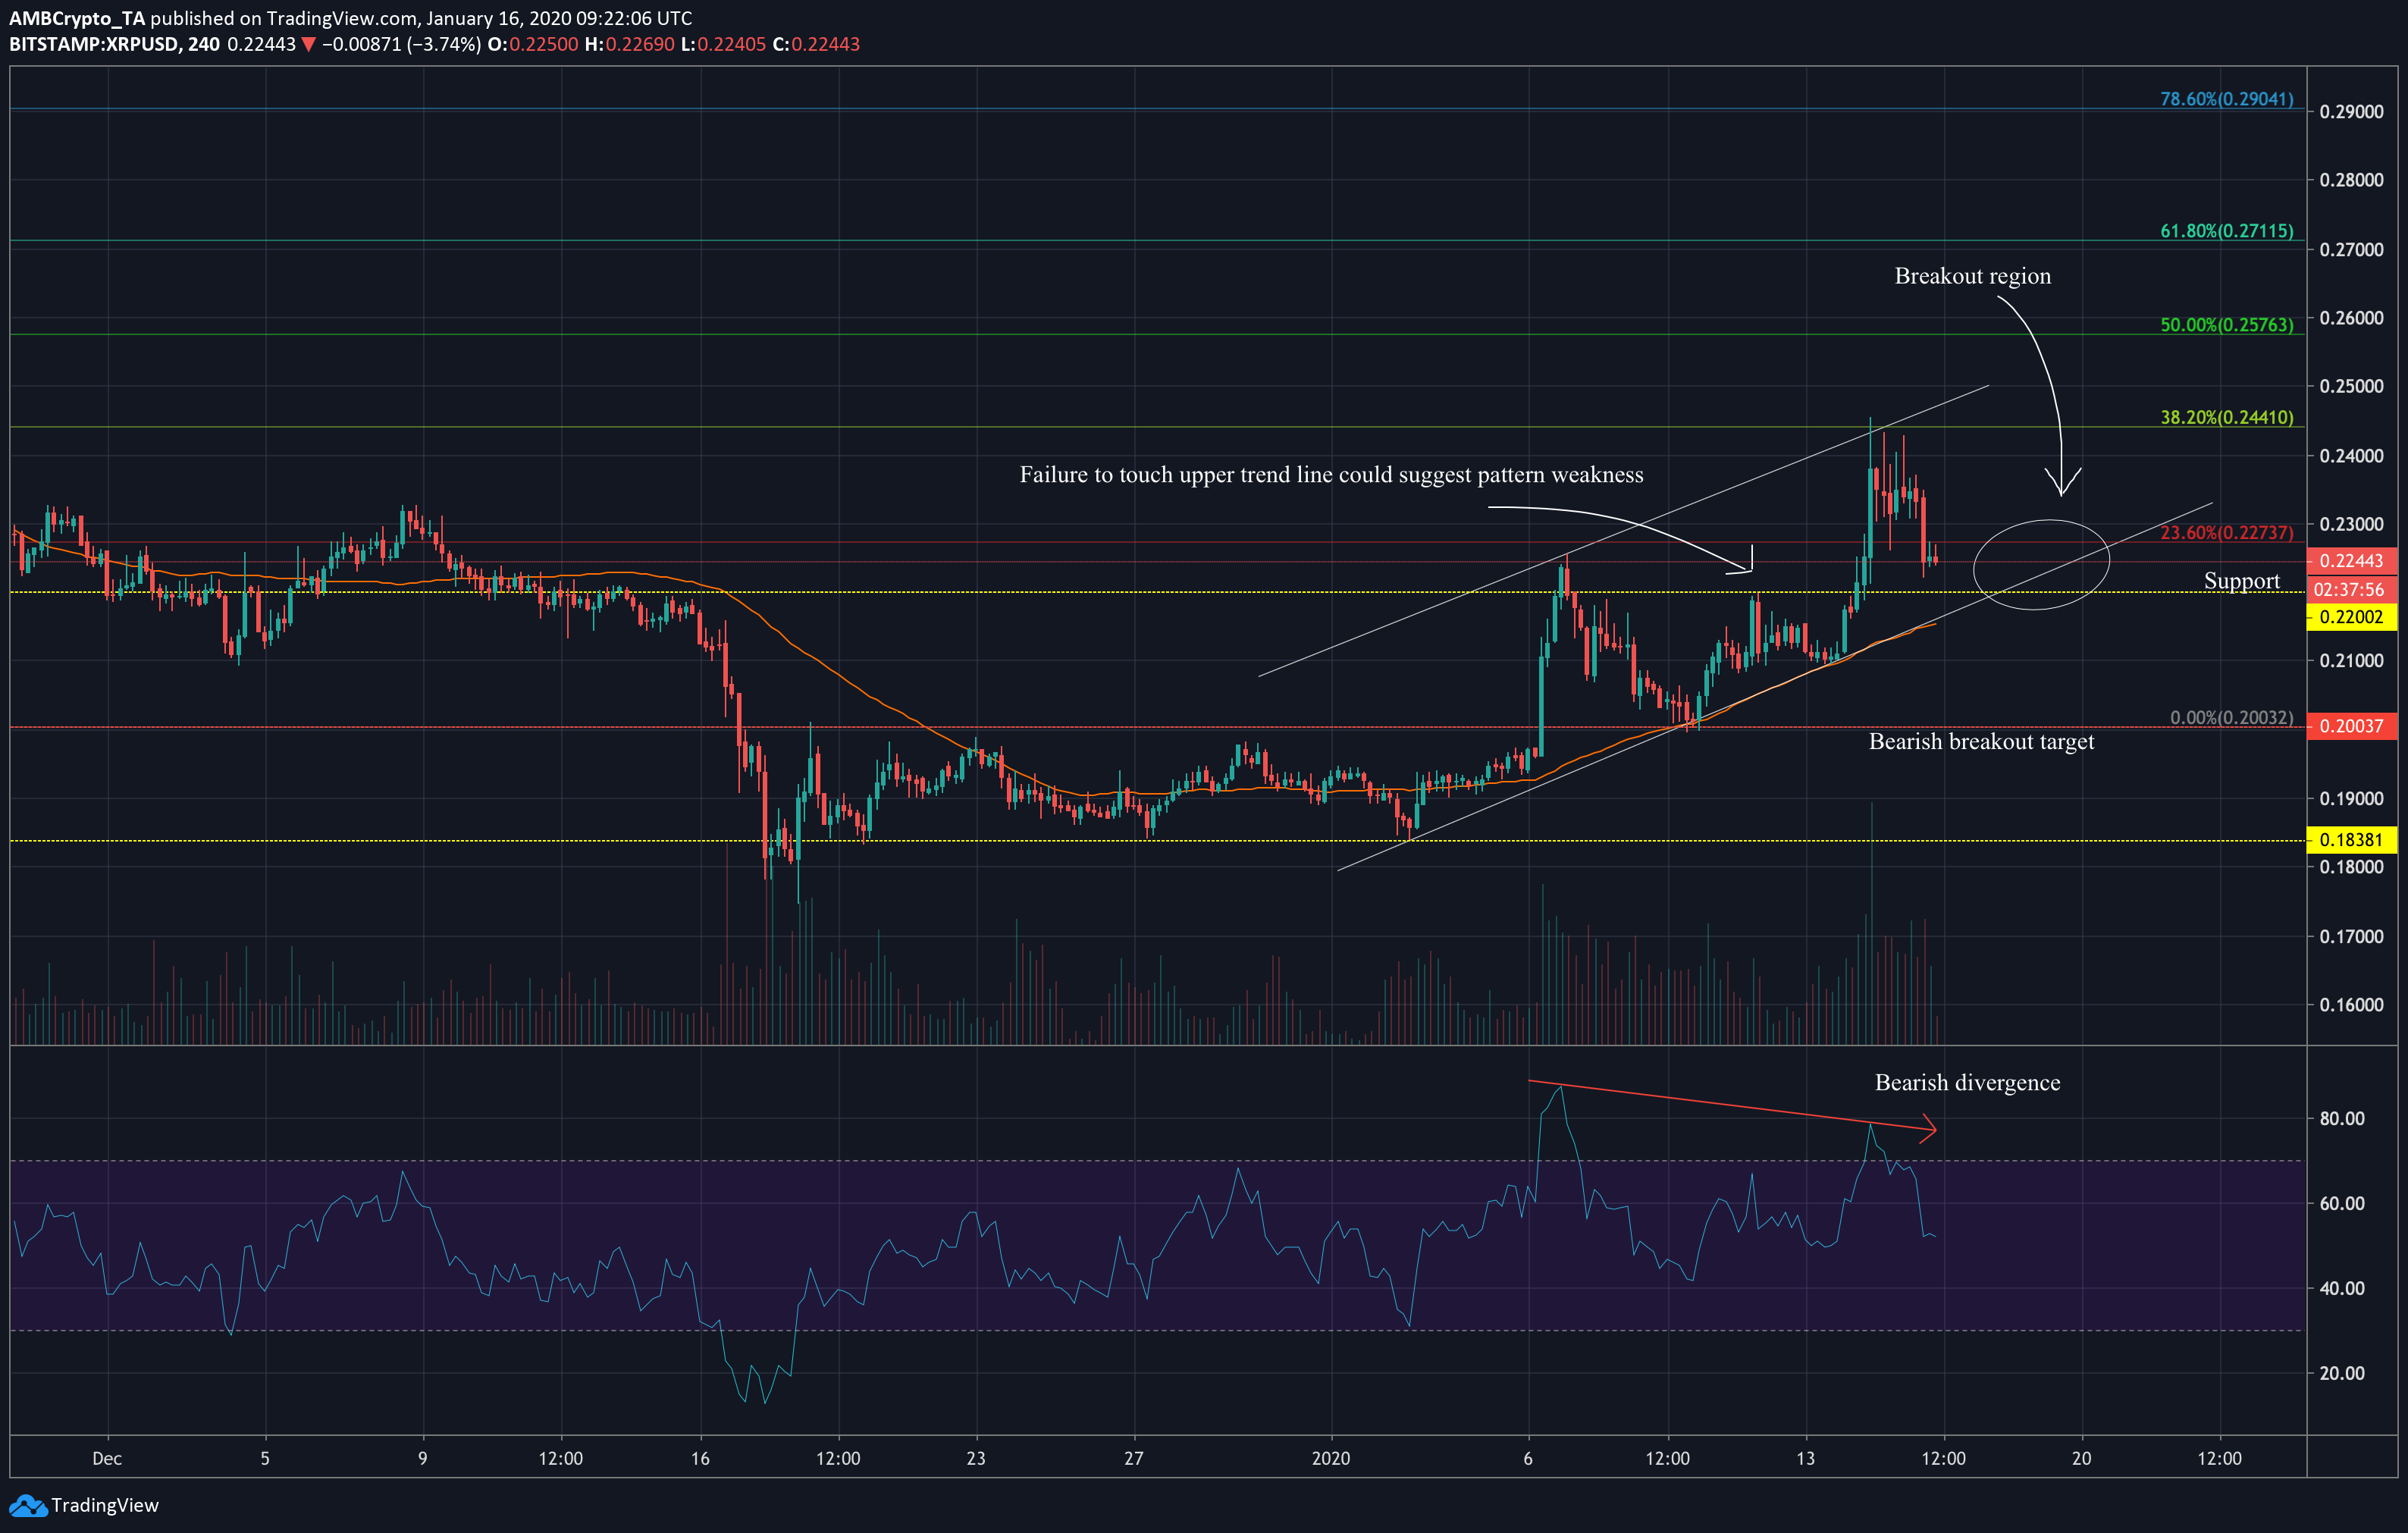
Source: XRPUSD on TradingView
The 4-hour chart showed XRP in an ascending channel formation, which it looked to have entered early on in the month. The volume could be seen spiking as the price approached the trend lines; however, the price’s failure to move all the way to the upper trend line after the third touch could suggest a weakness in the pattern and might indicate a more bearish market sentiment.
The 50-moving average was seen creeping up along the pattern’s lower trend line, well under the price candles, which is usually a bullish signal. However, the Relative Strength Index (RSI) indicator displayed a bearish divergence, where the price went up over the same period where the RSI indicator moved downward. This is usually a strong indicator of bearish movement for the near future.
In this scenario, XRP will likely move into the region between the support at $0.22, and the 23.6% Fibonacci retracement line at $0.227 in preparation for a downward-facing breakout.
On-Balance Volume
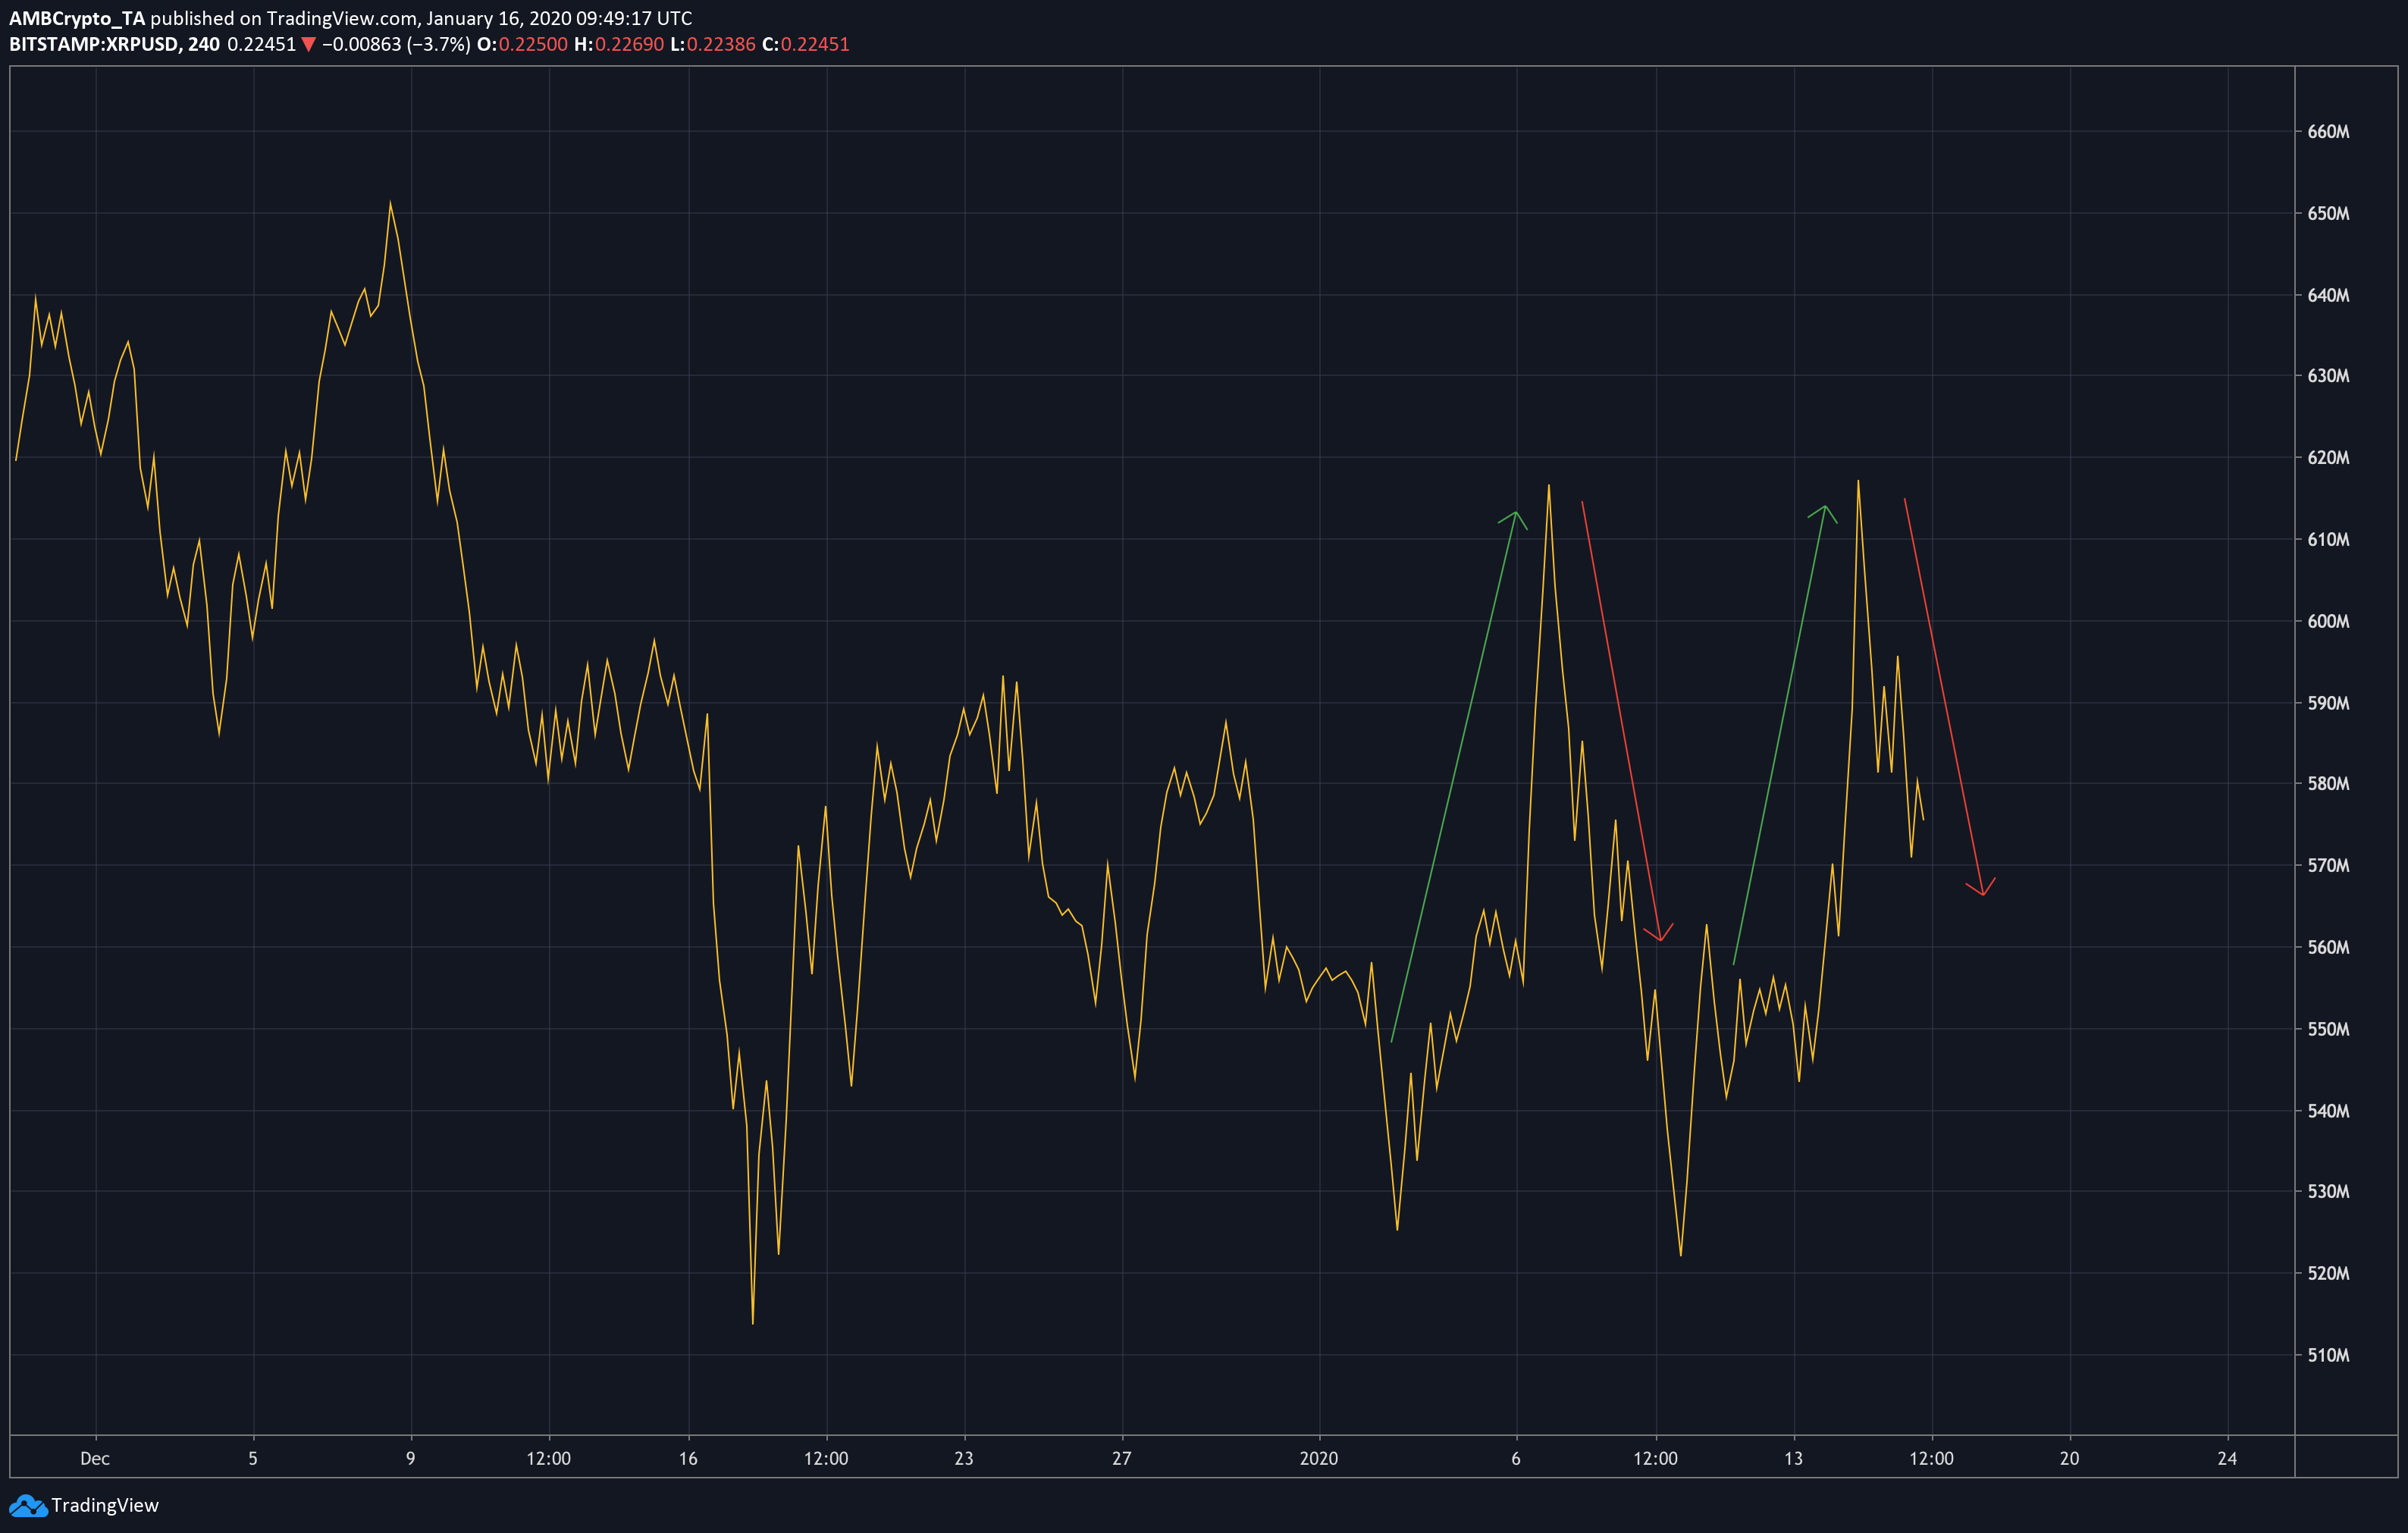
Source: XRPUSD on TradingView
The On-Balance Volume indicator, a running total of an asset’s trading volume, looked to be dropping since January 14, and could be retracing its movement from just a week prior. The reducing trade volume could mean some sideways movement for XRP until it moves into the breakout region.
From there, XRP is likely to break down to at least the 0% Fibonacci retracement line at $0.20 before the month is up, and could possibly dip further down to the $0.183 support in the weeks following.
Conclusion
XRP is likely to experience some sideways movement on the 4-hour chart until it enters the breakout region between $0.22 and $0.227. From here, XRP will probably break downward and could drop to at least $0.20 before February arrives.