XRP, Cosmos, VeChain Price Analysis: 20 November

While many altcoins saw their price appreciate dramatically in the past week, the surge has not been uniform across the market’s altcoins. Popular altcoins like XRP, Cosmos, and VeChain saw short-term spikes in their trading price, but have been confined to mostly sideways movement in the past few days.
XRP

Source: XRP/USD, TradingView
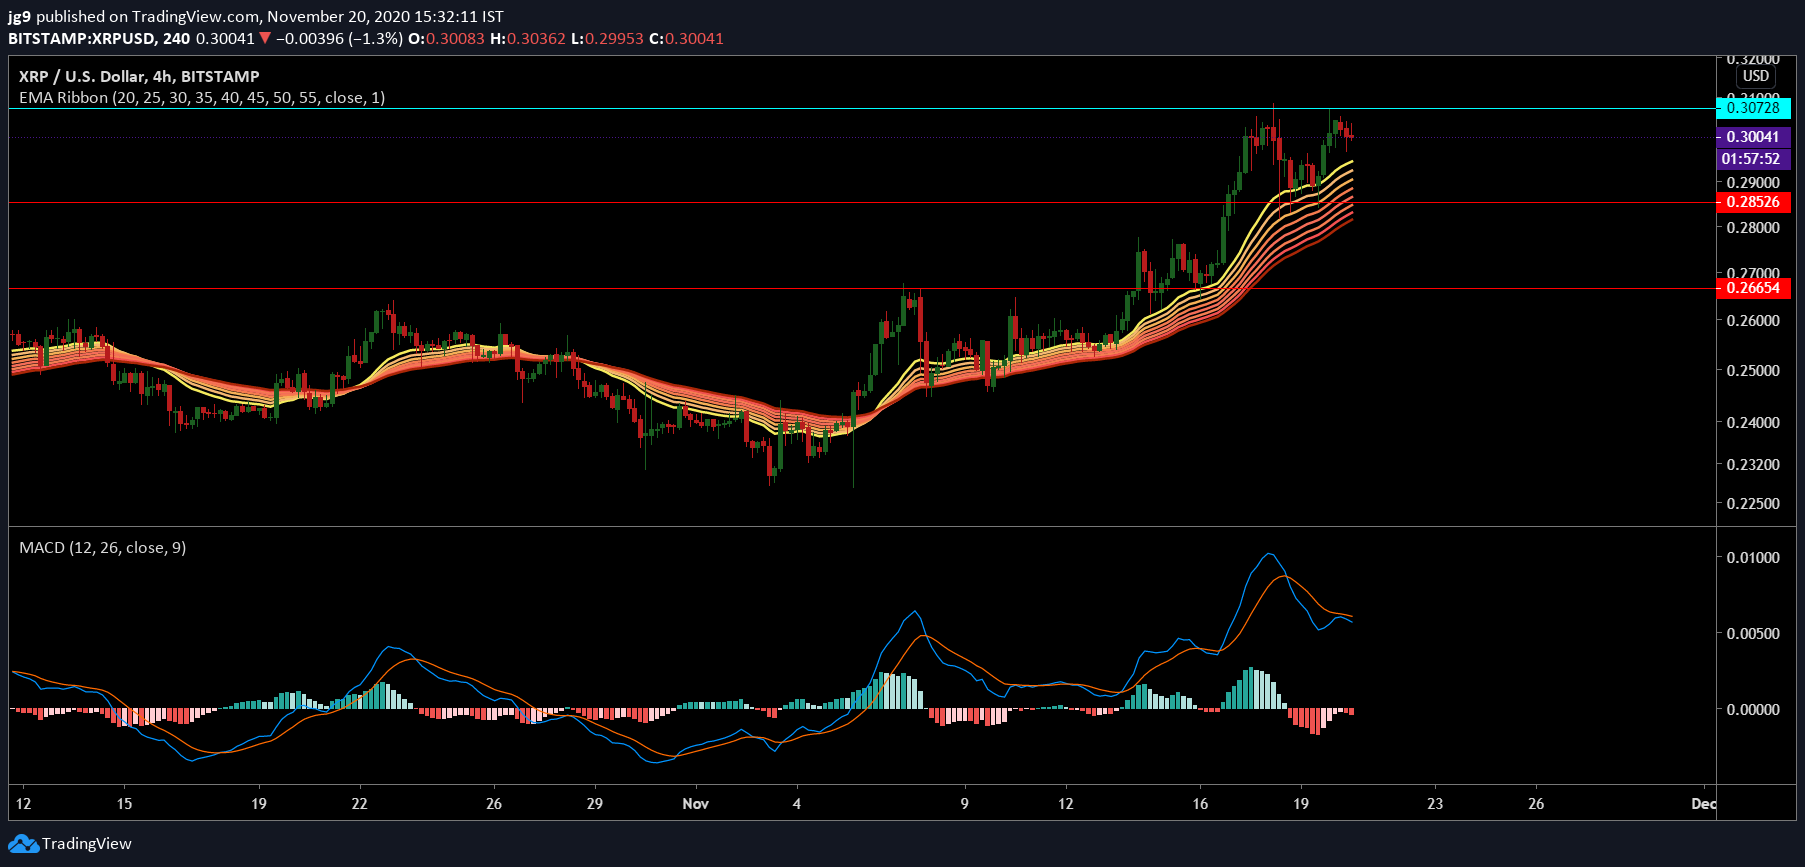
XRP price has moved between the $0.28 and $0.307 price level in the past few days. At press time XRP is being traded at $0.300 with a market cap of $13.5 billion. During the past 24-hours, the coins have been unable to breach the resistance at $0.307. If the coin loses its bullish momentum the supports at $0.285 and $0.266 can help the price.
The EMA ribbons have settled right below the trading price and are likely to offer support if the price of XRP falls even further. The MACD indicator shows strong bearish sentiment as the signal line has now gone past the MACD line.
Cosmos [ATOM]

Source: ATOM/USD, TradingView
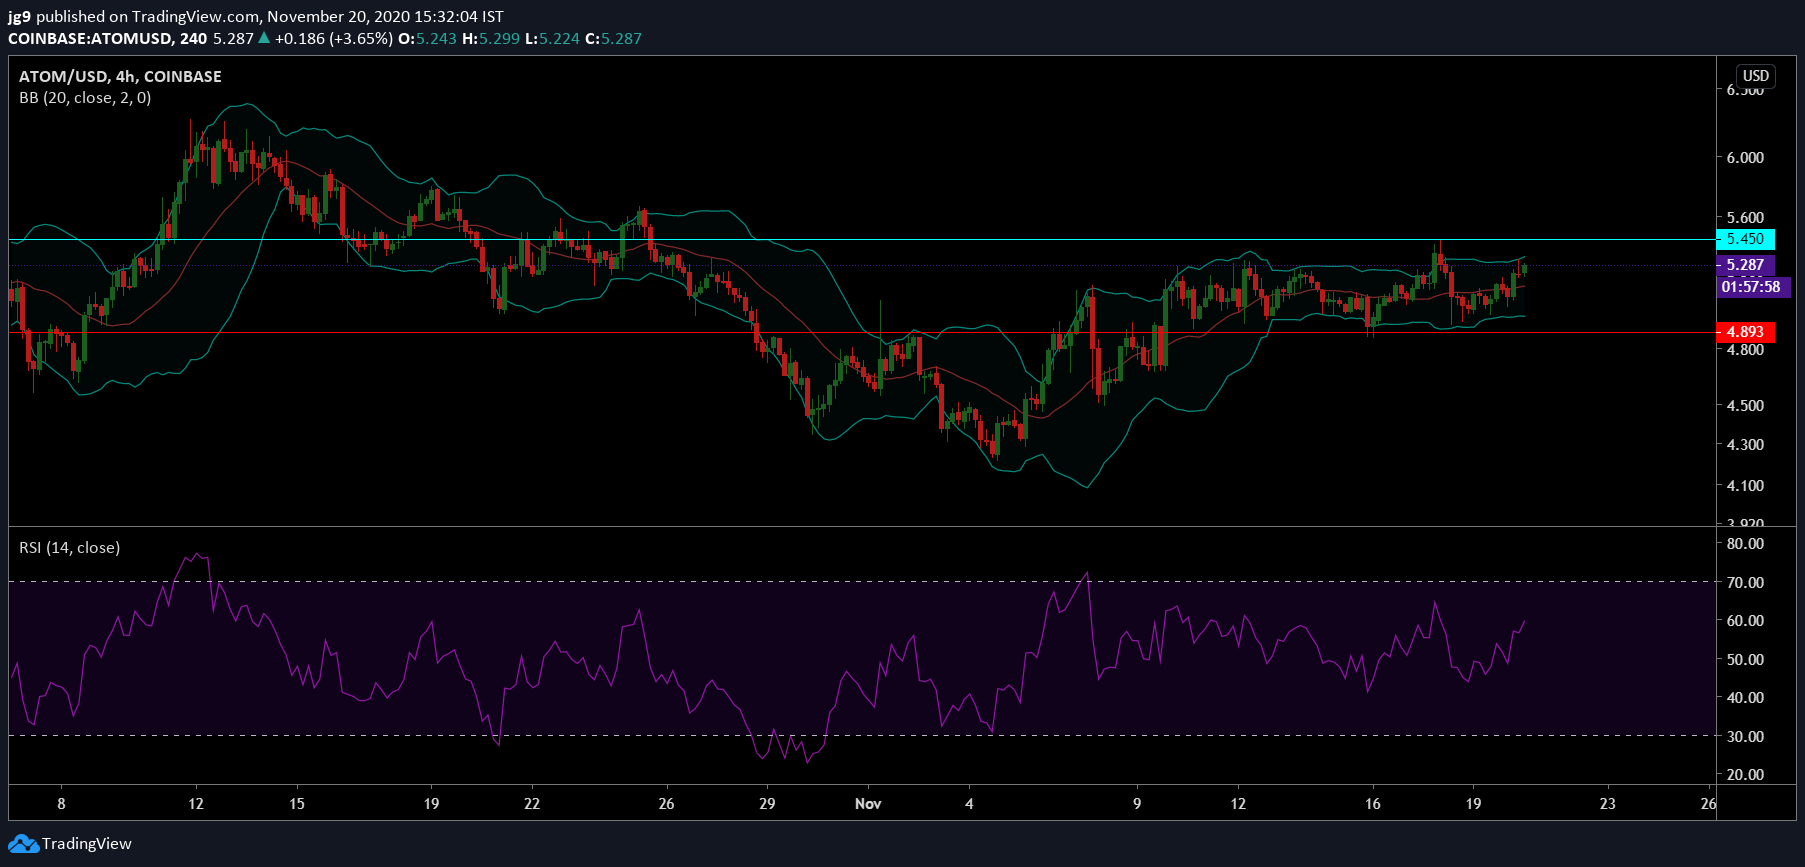
The fate of Cosmos was very similar to that of XRP. During the past 7 days, the price of Cosmos rose by over 3 percent and is currently being traded at $5.2. However, the past few days saw increased sideways movement for the coin. At press time Cosmos faces significant resistance at the $5.4 price level and support at $4.8.
The Bollinger Bands have contracted significantly and indicate very low volatility for the coin. The RSI on the other hand looks promising as it now heads into the overbought zone.
VeChain [VET]

Source: VET/USD, TradingView
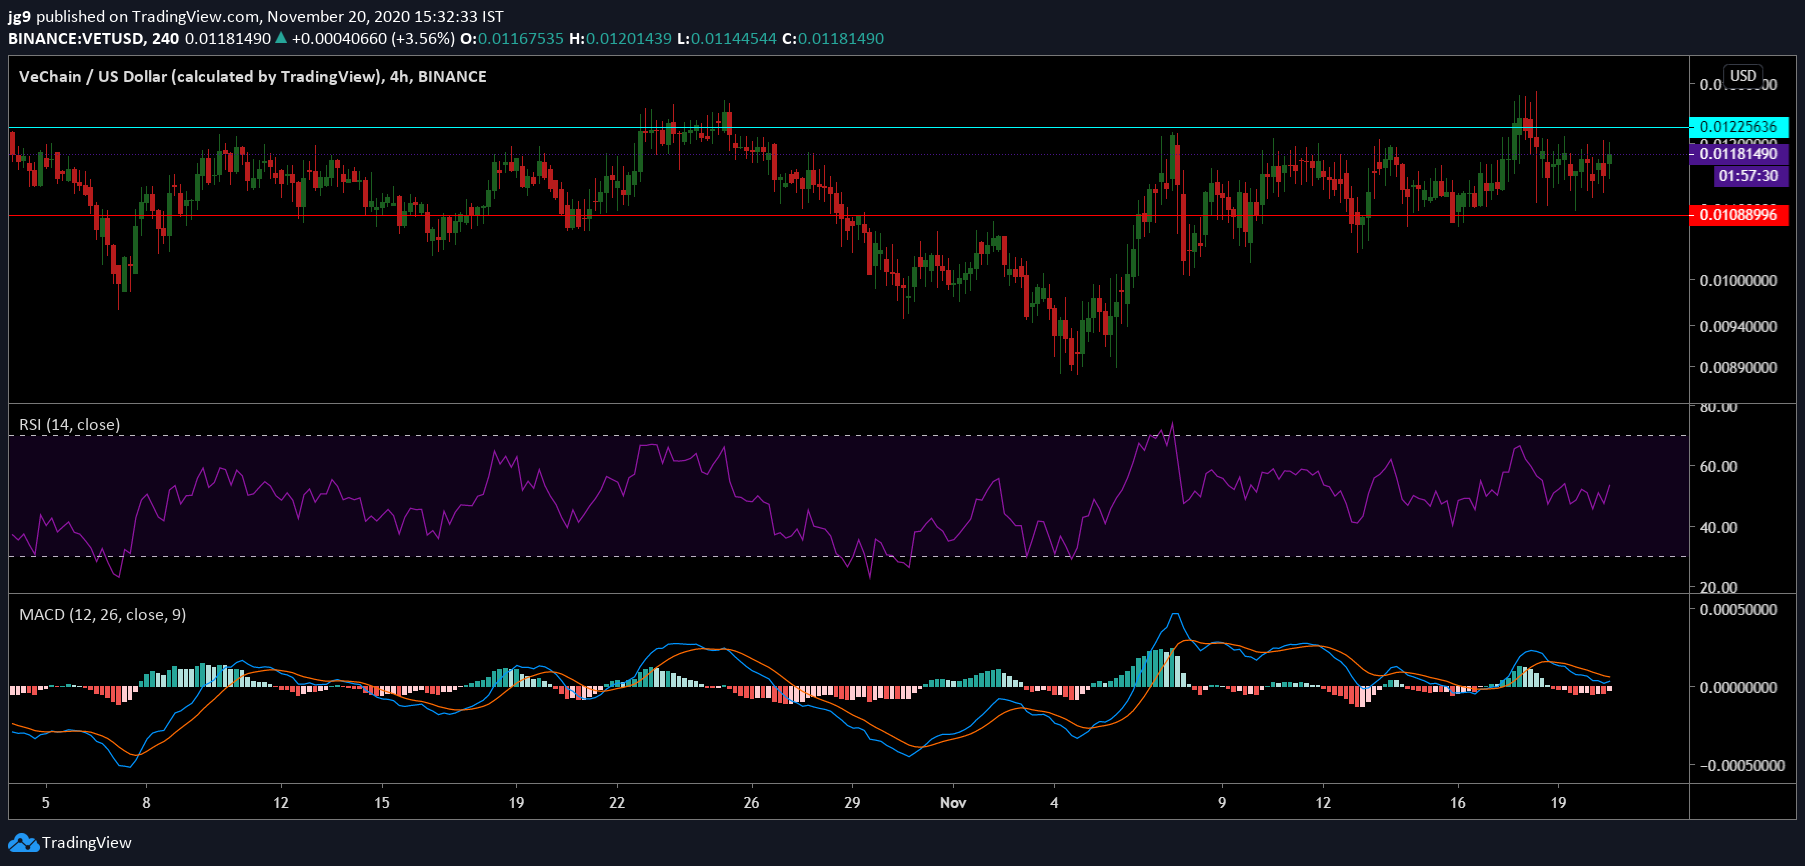
VeChain is currently ranked 31st on CoinMarketCap’s list and is being traded at $0.011 and has noted a trading volume of $91 million. If the coin is able to break out of the consolidation phase that was witnessed in the past 2-3 days then it may head towards the resistance at $0.012. There is also a support at $0.010 if the coin were to see its price drop.
The RSI indicator is now moving away from the neutral zone and is now heading towards the overbought zone. However, in the case of the MACD indicator, a bearish crossover has happened and signals an upcoming price drop.


