
In the previous article, we looked at the top-10 worst days of Bitcoin in the bearish year of 2018. The reason for going back to this year, while a bull-run is ongoing now in 2020, is to understand what kind of strategy works? Since 2018 was a bad-year all round for the BTC market, ‘works’ indicates the least amount of loss, rather than a decent profit, because there wasn’t any.
To sum up the findings from the top-10 worst days, the average loss you would’ve made was 11.7 percent, meaning for our arbitrary investment of $260, on each of the 10 days, totaling $2,600, you would’ve made $2,294.5 or a 11.7 percent loss. Now, let’s see how a simple dollar-cost-averaging strategy works.
Back to basics
Using a simple DCA, for only the weekdays of 2018, we have a total of 261 buying days. If we buy $10 of Bitcoin every day for the entire year, we make a total investment of $2,610, across 261 transactions, each valued at $10.
Since the price continues to decline, we continue to buy more Bitcoin. However, since the decline does not turn around, our losses stay losses, and it gets worse with each passing day. Here’s how the DCA approach panned out in 2018.
| Buying days | 261 |
| Buying amount | $ 10.00 |
| Total buys | $ 2,610.00 |
| Total BTC bought | ₿ 0.379085 |
| BTC price at close | $ 3,866.84 |
| Average BTC buy price | $ 7,570.87 |
| Investment at close | $ 1,465.86 |
| Change $ | $ (1,144.14) |
| Change % | -43.84% |
The total BTC bought amounts to 0.379, at an average buying price of $7,570. Since Bitcoin closed at $3,866 on December 31, the loss from purchasing Bitcoin at the average is over 95 percent, while the loss from purchasing Bitcoin at its 2018 high (at $16,400) is over 330 percent. What kind of loss does the DCA give you? A loss of 43.8 percent, which means that the initial investment of $2,610 made in 261 separate $10 transactions, from the 1st of January to the 31st of December amounted to $1,465. Once sold on the last date of the year at $3,866 per BTC, the return was a loss of $1,144.14.
However, while a loss, is a loss, it’s all about context. Bitcoin lost 72 percent of its value in the entire year, an investment made at its peak would’ve made a loss of 330 percent, and yet a DCA would’ve given you a loss of 43.8 percent should account for something. This something is avoiding buying a lot of a depreciating asset as its price tumbles.
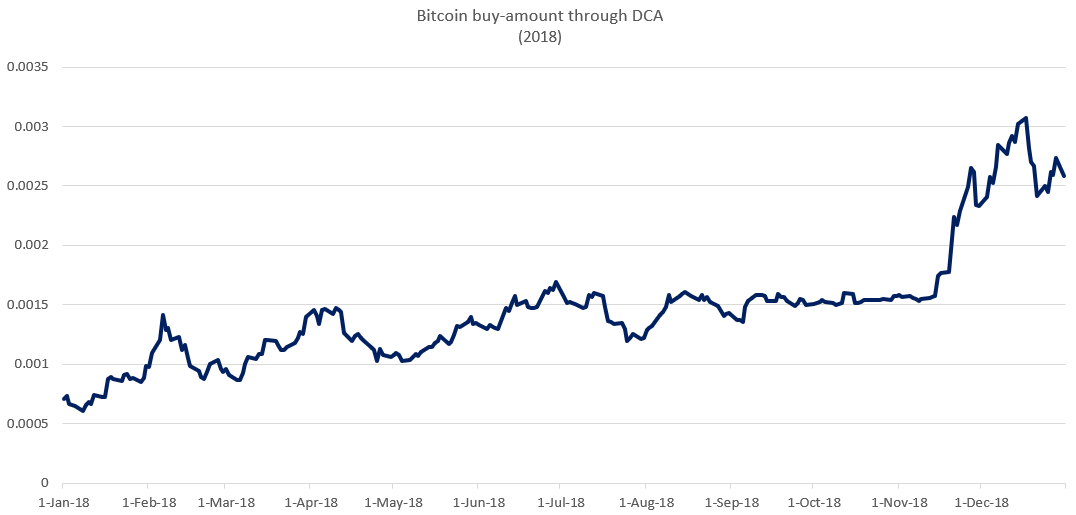
By the way, here’s how much Bitcoin you’d buy as the price follows. Another feature of the DCA approach is you accumulate more of the asset as the price falls, and since Bitcoin’s price fell hard in 2018, you’d have bought a lot more. It’s an inverse of the price chart.
In the final version of this three-part article, we’ll put it all together, and look at which strategy would be the least loss-ridden.