
With altcoins still playing second-fiddle to both Bitcoin and its leader Ethereum, many minor cryptocurrencies are mounting their own moves in the hope to build momentum and break out of stagnancy. Chainlink, a recent entrant into the top-20, is one such altcoin, in addition to Synthetix Network Token and Verge.
Chainlink
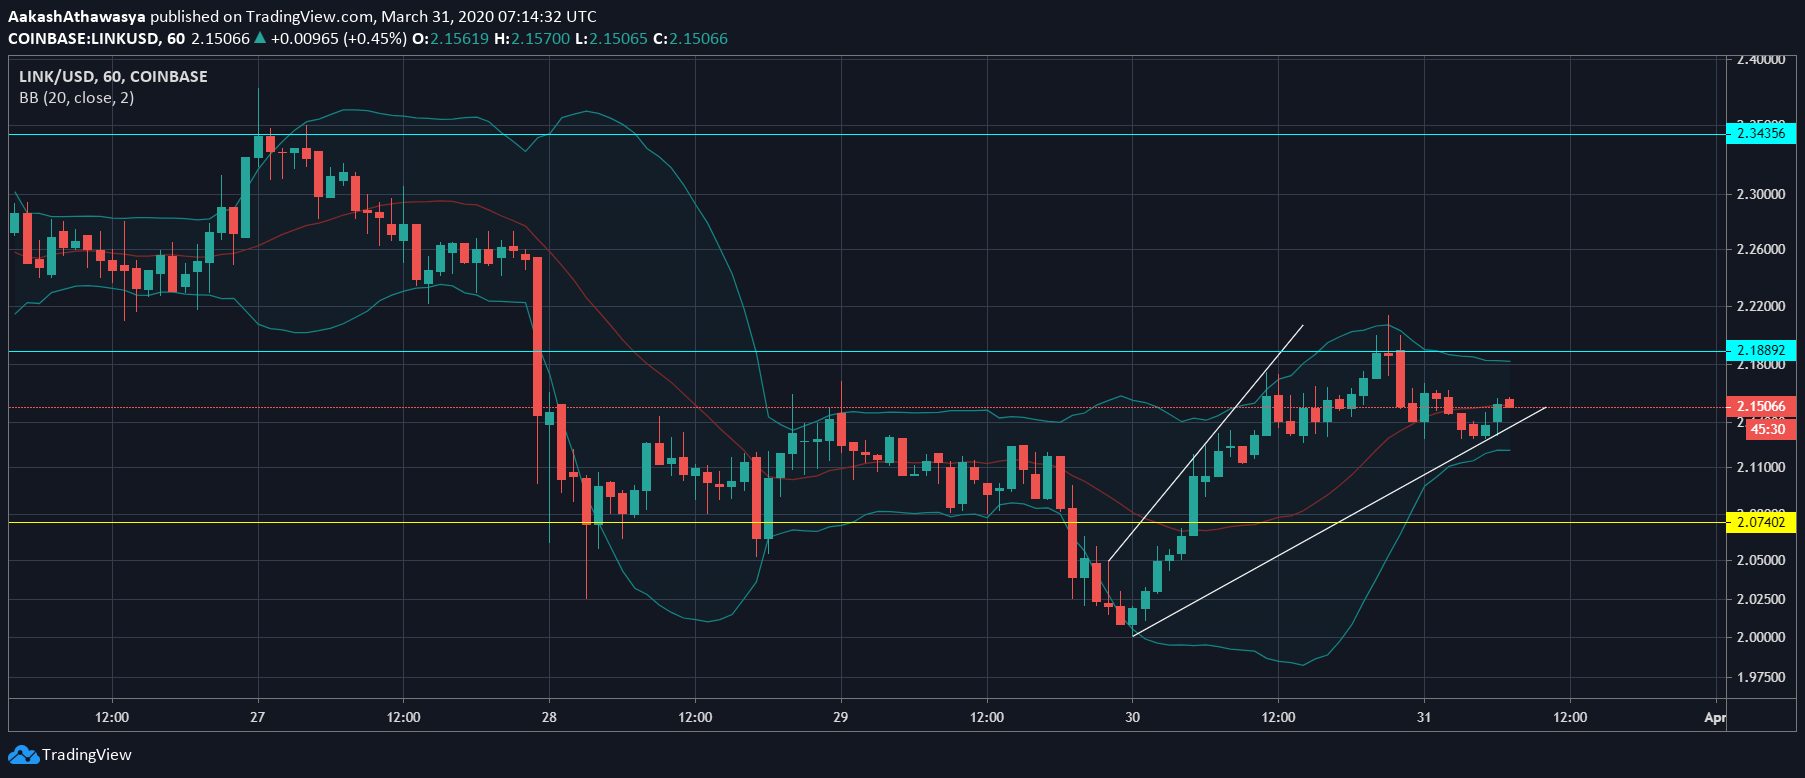
Source: LINK/USD via TradingView
The altcoin, one of the few to be listed on Coinbase was, in the short-term, trending higher and higher in an upward channel, with significantly higher highs and lower lows.
However, since this pattern was present on the 1-hour chart and the top seemed to have been reached, bouncing off the resistance level at $2.188, the press time price of $2.157 was flirting with the lower band of the channel at $2.146. Over the past 24-hours, LINK managed to increase by over 7.5 percent, breaking its previous support, now resistance, placed at $2.07.
The Bollinger Bands for the altcoin were contracting, indicative of a drop in volatility as the price looked to consolidate at $2.15. The average of the same had slipped below the price candles, indicating a move up, with strong support present below.
Verge
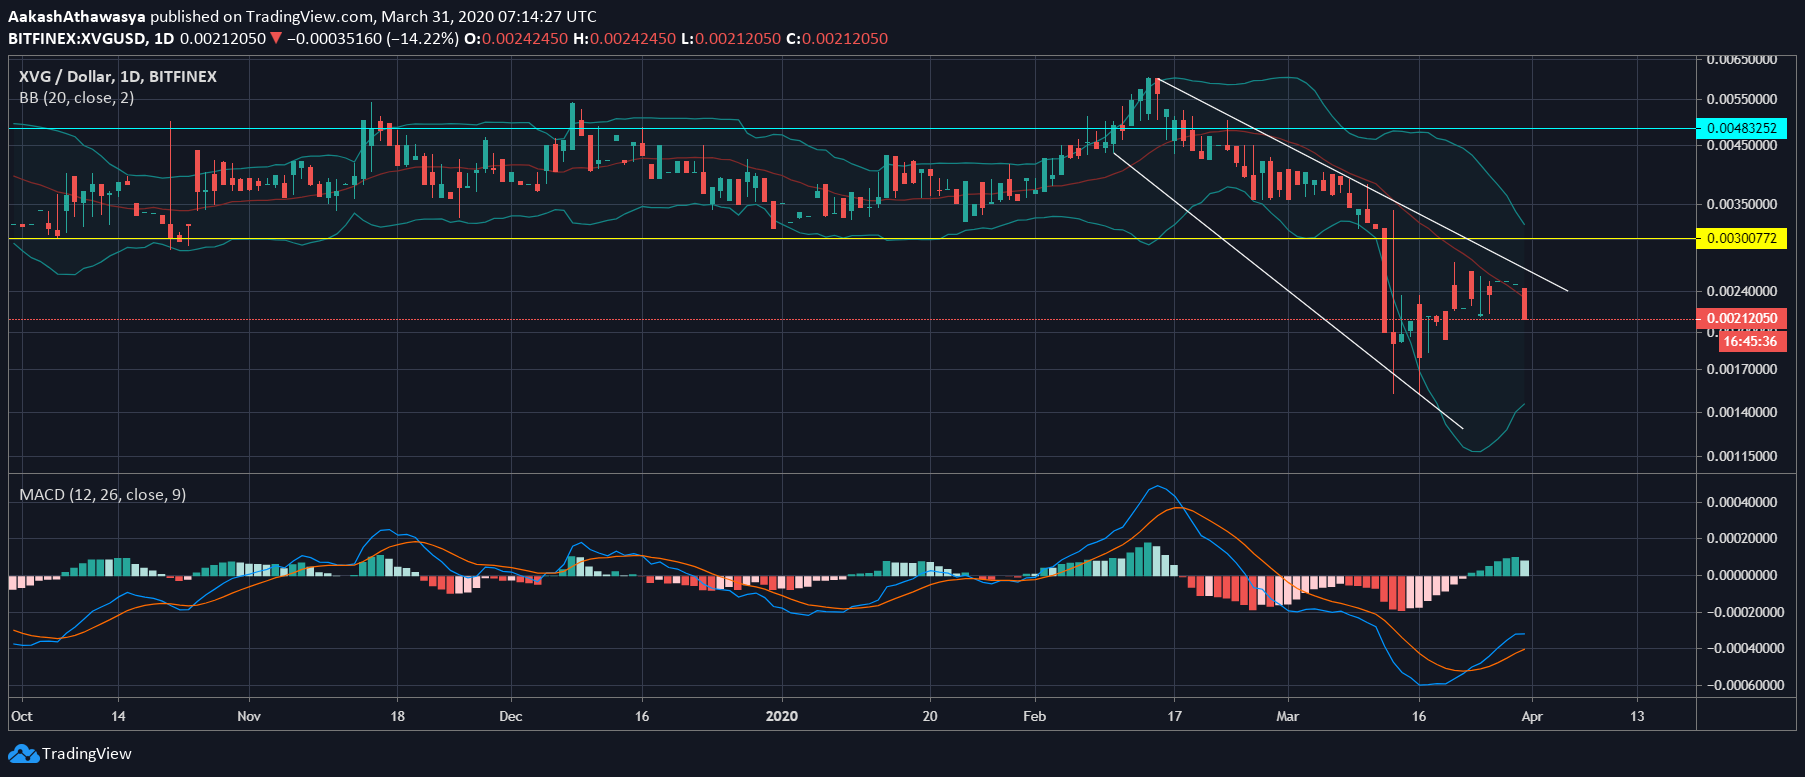
Source: XVG/USD via Trading View
For Verge, strong bearish momentum was accelerated by the 12 March drop, during which the altcoin lost over a third of its value. The press time price of the cryptocurrency was $0.0021, up by 18 percent since the aforementioned low, but plagued by red price candles.
The drop took XVG down below its long-term support level at $0.003, which will now act as a strong resistance should the price move up. Given the formation of a strong downward channel since mid-February and the paucity of trades giving the thinning candles, the move out will be stifled by lack of liquidity and momentum.
The MACD for the altcoin suggested a bullish move as the MACD line had moved over the Signal line, with the trend still below 0; mildly bullish signs, but bearish in the larger scheme of things.
Synthetix Network Token
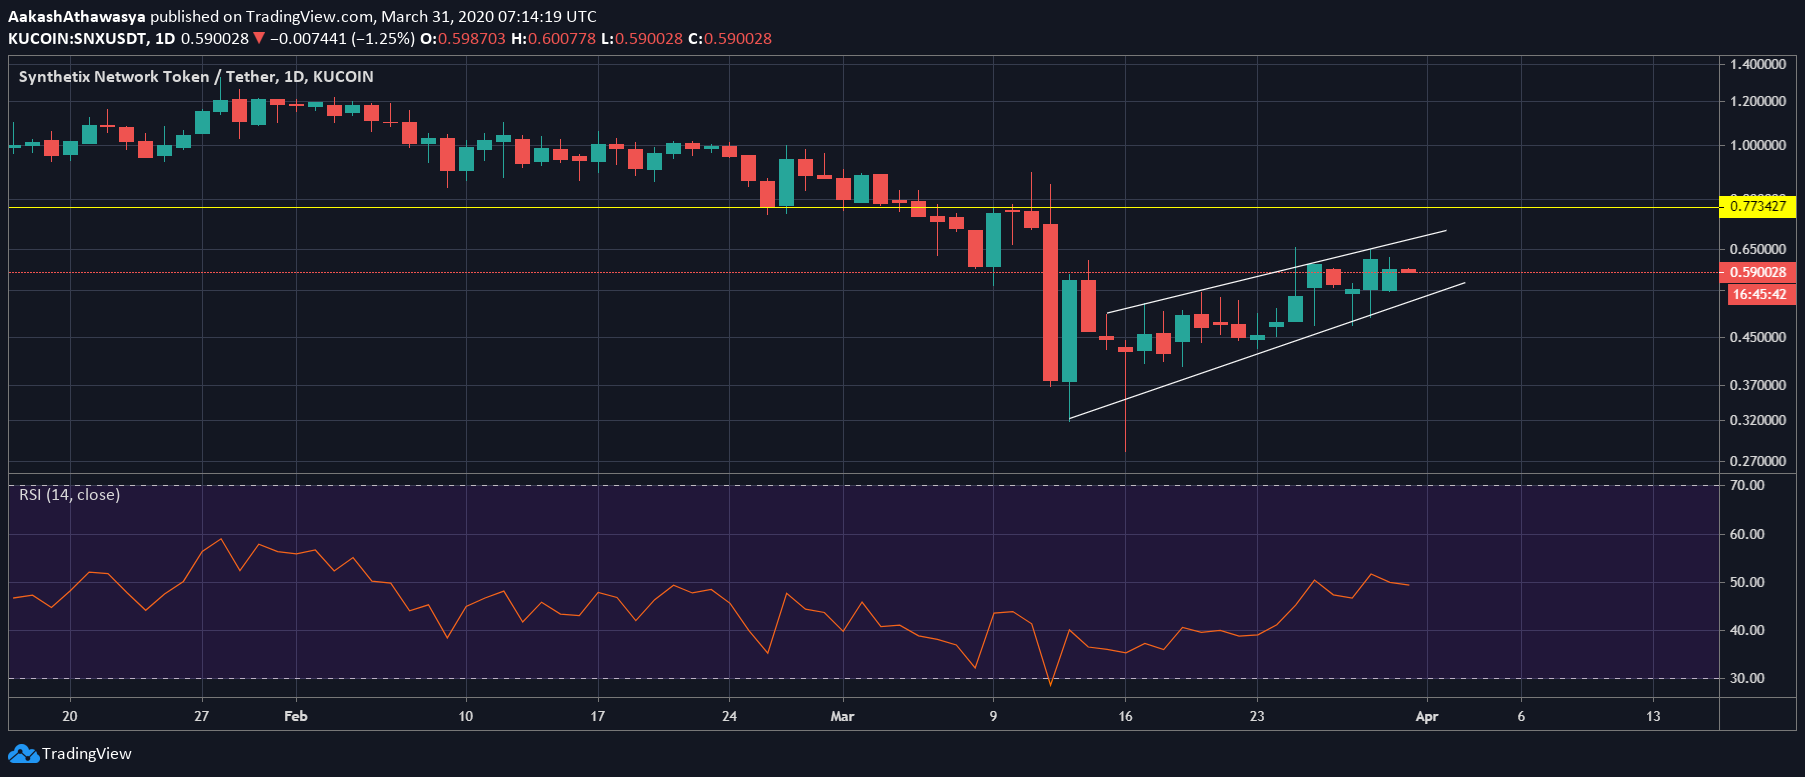
Source: SNX/USD via Trading View
The SNX chart has been taken from the exchange KuCoin, which is the only available exchange to list the altcoin on TradingView. According to CoinMarketCap, KuCoin is ranked 72 by adjusted volume, 91 by reported volume, and 25 by liquidity.
SNX was trading within a sharp rising wedge as the higher-lows and higher-highs kept compounding. With the drop seen on 12 March, it formed a mild bearish flagpole, with the prices since then forming the actual flag. The altcoin was trading at $0.590, with strong support present at $0.773, a level that has to be broken either with the persistence of the wedge or a breakout from it.
The RSI for SNX, after surging from below 30 to over 50 in the past two weeks, saw two pushbacks, albeit relatively increasing. The RSI at press time stood at 49.44, healthy, but still in need of price momentum to move up.