Analysis
Tezos long-term Price Analysis: 3 September

Disclaimer: The following article attempts to analyze the emerging patterns in the long-term Tezos market and its impact on the price
Tezos [XTZ] was among the market’s best-performing assets in 2019. It has continued to do so in 2020, with the digital asset noting YTD returns of over 110%, at the time of writing. However, even though the overall performance of the coin was strong, the spot price was taking a hit due to the associated sell-offs. In fact, this also opened the gateway to greater volatility in Tezos’s market.

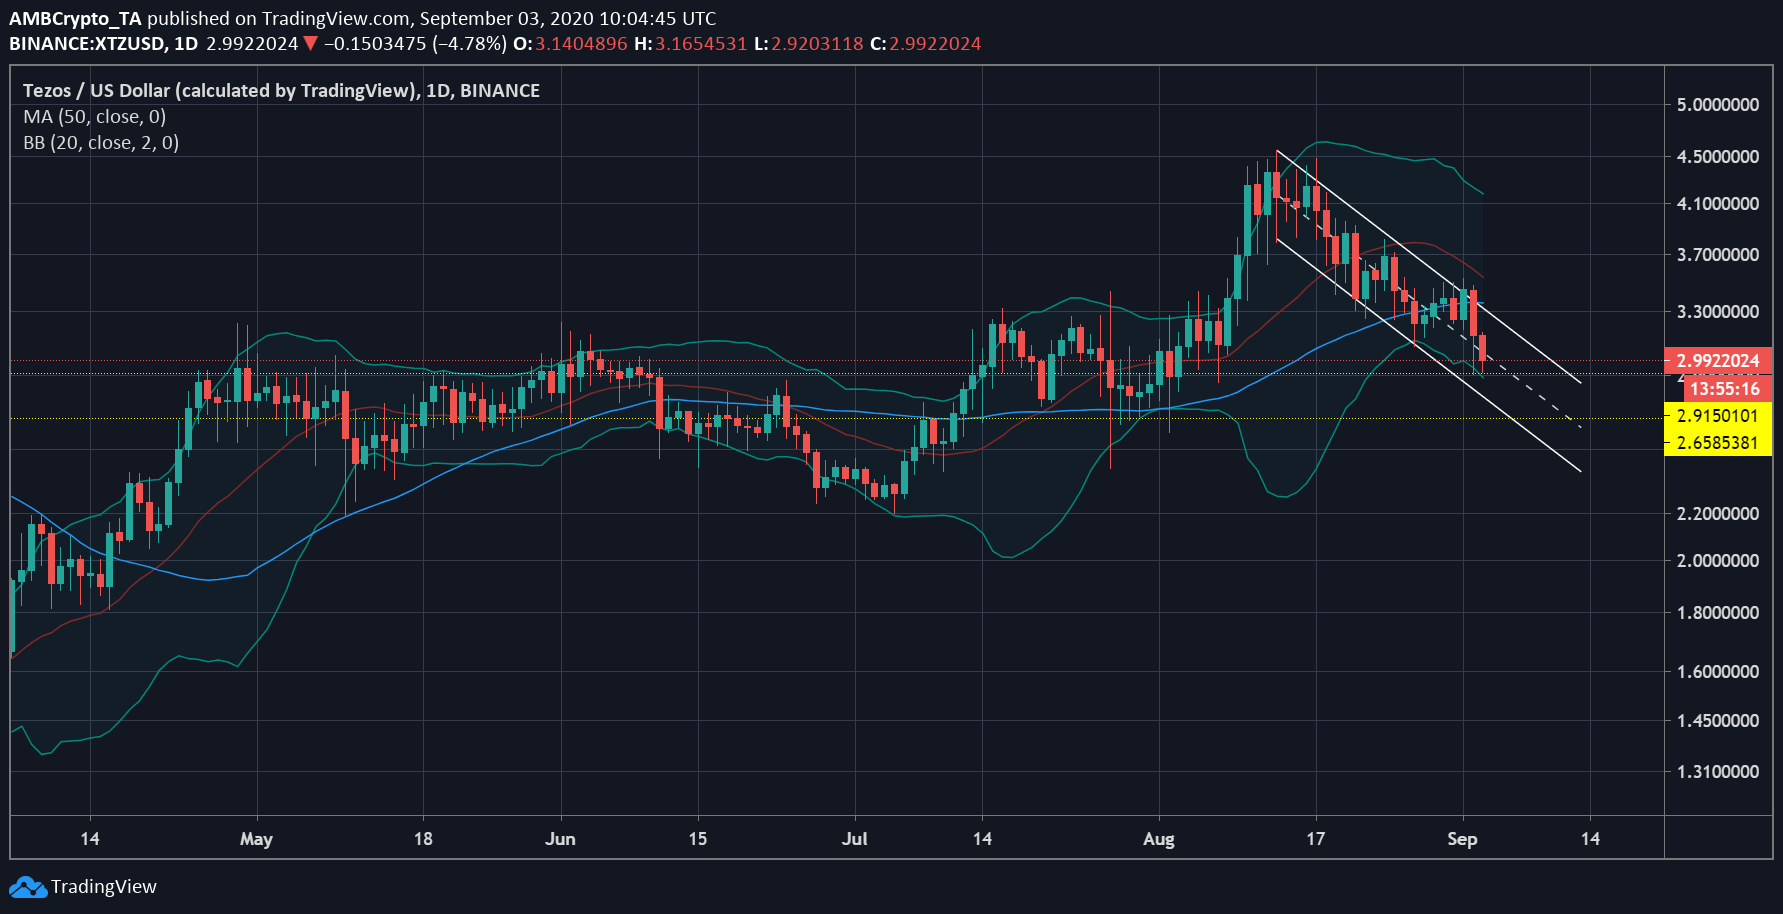
Source: XTZ/USD on TradingView
The attached chart highlighted that the price of Tezos was noting a steep fall from $4.56 to $2.99, at press time. This sudden loss in value resulted in great volatility in Tezos’s market. The same was underlined by the Bollinger Bands since they seemed to be diverging on the charts. Further, the Signal line was hovering above the price bars, representing the price swing that was recently noted by the cryptocurrency’s market.
The 50-Moving average was also reflecting the change in price trends, with the same moving above XTZ’s press time price. In fact, the price was part of a descending channel, a formation that is considered to be a bearish pattern. As XTZ moved further down, the target level for the coin was $2.915, after which it may bounce back. $2.915 has been a strong support level for the cryptocurrency in the past, and the same could help rejuvenate XTZ’s falling price. If the selling pressure increases at this point, the level for XTZ was $2.658.
Further, irrespective of Bitcoin’s movement, XTZ has been noting falling correlation metrics with the world’s largest digital asset.
Source: CoinMetrics
As per the attached chart, the BTC-XTZ correlation was going strong until 26 July, following which, volatility shook up the market. The correlation of 0.8135 was slashed and fell to 0.7913 by 2 September. However, the fall in the correlation coefficient did not provide any more independence as the correlation continued to be largely strong.

