Analysis
Tezos long-term Price Analysis: 20 August
Tezos is being given a lot of attention lately by a specific few traders, most of whom expect huge returns, very much like LINK. In fact, this optimism is not misplaced, but is backed by XTZ and LINK’s lack of correlation with Bitcoin, the world’s most dominant cryptocurrency. Regardless, XTZ does have some potential for a surge, at least in the medium-term timeframe.
Tezos 4-hour chart
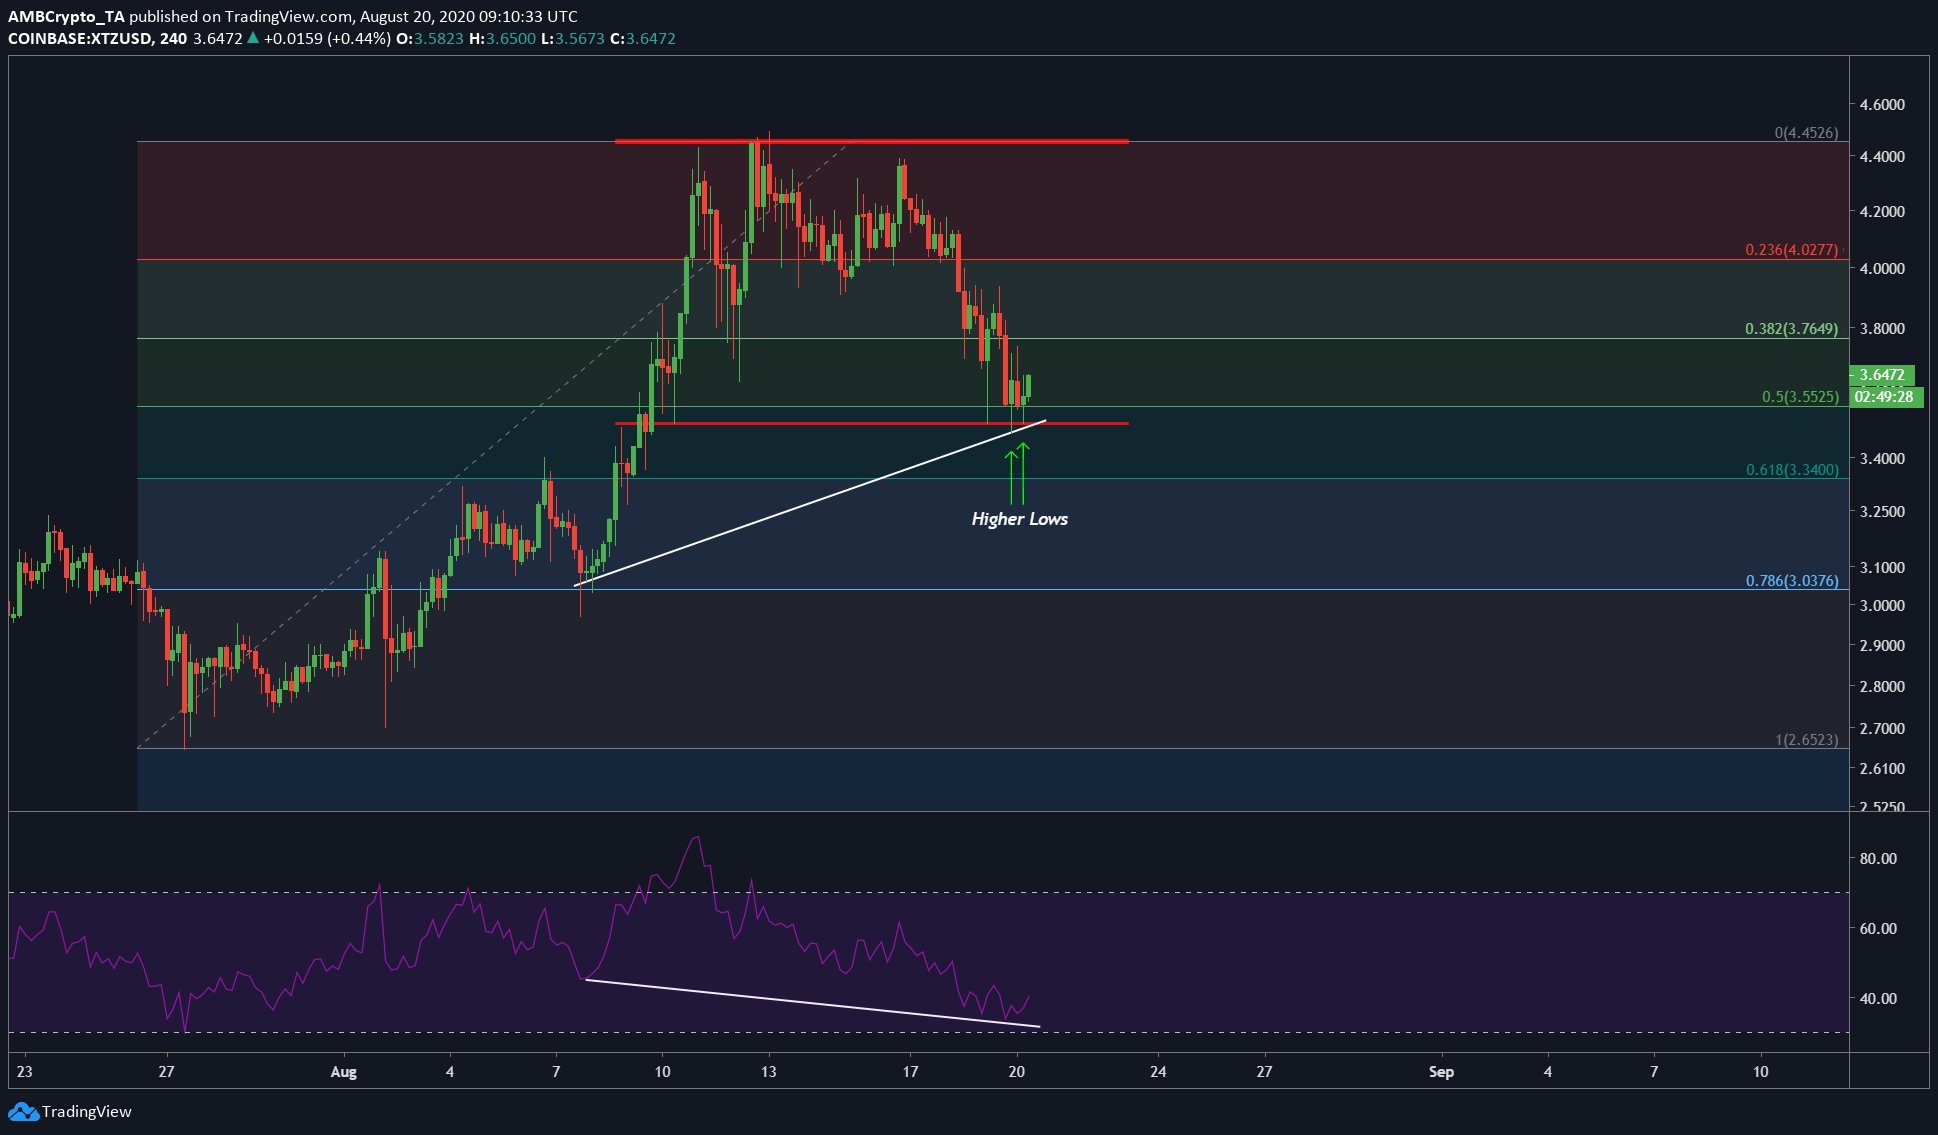
Source: XTZUSD on TradingView
The attached chart showed XTZ range-bound between $4.45 [local top] and $3.50 [local bottom]. Judging by the green candle that was being formed, it looked like XTZ was ready to respect the range and bounce higher. Here are three points why this local bottom will not just hold, but will also propel XTZ back to $4.45 or at least near it.
- The candles at the local bottom have started forming higher lows, which is an indication of a trend change.
- The RSI and price have formed a divergence, and it is a hidden bullish divergence. This is when the price forms a higher low while the RSI forms a lower low.
- Last but not the least, the Fibonacci retracement tool shows that the range is just above the 0.5-Fibonacci level, a common level for prices to find support.
Hence, the most optimal position to be here would be to go long.
Additionally, the candles near the 0.5-Fib level all closed above it, hence, making this another reason for XTZ to head higher. As for the RSI, it had already hit the oversold zone on the 4-hour time frame and started its reversal. This was, yet again, a bullish signal.
$3.63 is an optimal entry point with stop loss at the end of the liquidity pocket [$3.5009] aka risking a loss of 3.53% of the lot size. The profit, however, can vary based on the target. A conservative target could be at $4.09, which would be a 12.70% surge from the entry point. The target could extend all the way to the top of the range [mentioned above].