Analysis
Tezos long-term Price Analysis: 14 September

Disclaimer: The findings of the following article should not be taken as investment advice as it is the sole opinion of the writer
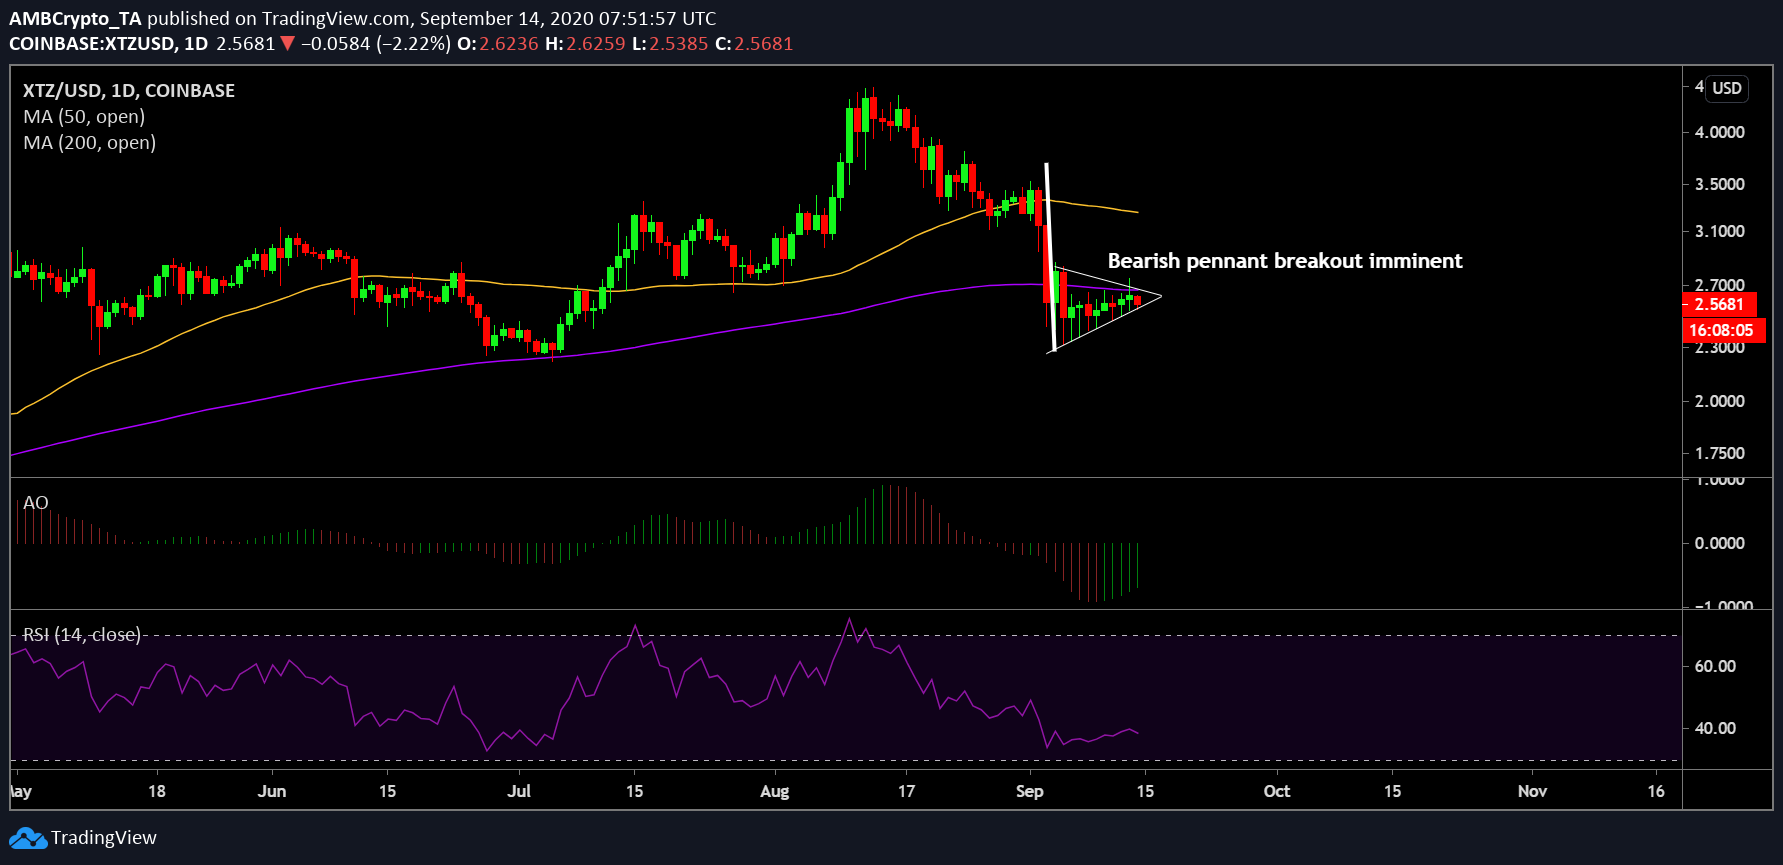
Many of the market’s cryptocurrencies failed to take advantage of the previous week’s period of recovery. Tezos was one of these crypto-assets, with XTZ’s movement upwards rather lackluster after the monumental drop on 1-2 September. Bearing a press time valuation of $2.56, the 16th-ranked Tezos was looking at another week of corrections on the charts.
Tezos 1-day chart

Source: XTZ/USD on TradingView
When the 1-day chart was observed, it was clearly identified that the crypto-asset was giving shape to a bearish pennant. After the aforementioned decline, the recovery period has been infinitesimal. Alongside the lack of significant recovery on the charts, XTZ’s valuation also pertained within the trendlines of the pennant. In fact, at the time of writing, it was very close to another move down south.
On observing the market indicators, it was found that the Awesome Oscillator suggested that considerable bullish momentum was still brewing in the market. However, the RSI was clearly on the sell-pressure side. The overhead resistance presented by the 200-Moving Average also solidified the press time bearish case for Tezos.
The case for an even bigger fall
Source: XTZ/USD on Trading View
Now, if the breakout in question eventually dismisses all bullish claims and bears take dominant charge, there is the possibility that XTZ will retrace down to its value pre-5 July. The Fibonacci retracements were underlining that XTZ was firmly placed under the 0.236 Fib and the drop could take place all the way down to 0 Fib line.
A long term short-position is attainable in this situation. Keeping an entry-level at $2.67, the take profits can be taken at $2.21 for a Risk/Reward Ratio of 6.57. A stop-loss should be kept at 42.74 since the crypto-asset had tested that range over the past 24-hours.

