Analysis
Tezos holds fort, but uncertain times ahead for IOTA, FTT

For an industry that is known and perhaps, popular for its inherent volatility, the past few days have been interesting to observe. Bitcoin, the world’s largest cryptocurrency, continued to consolidate its position under the $7.3k mark, while most of the market’s altcoins did the same. However, some alts did continue to record impressive gains over the last few hours and days, with Tezos, IOTA, and FTX’s FTT among them.
Tezos [XTZ]

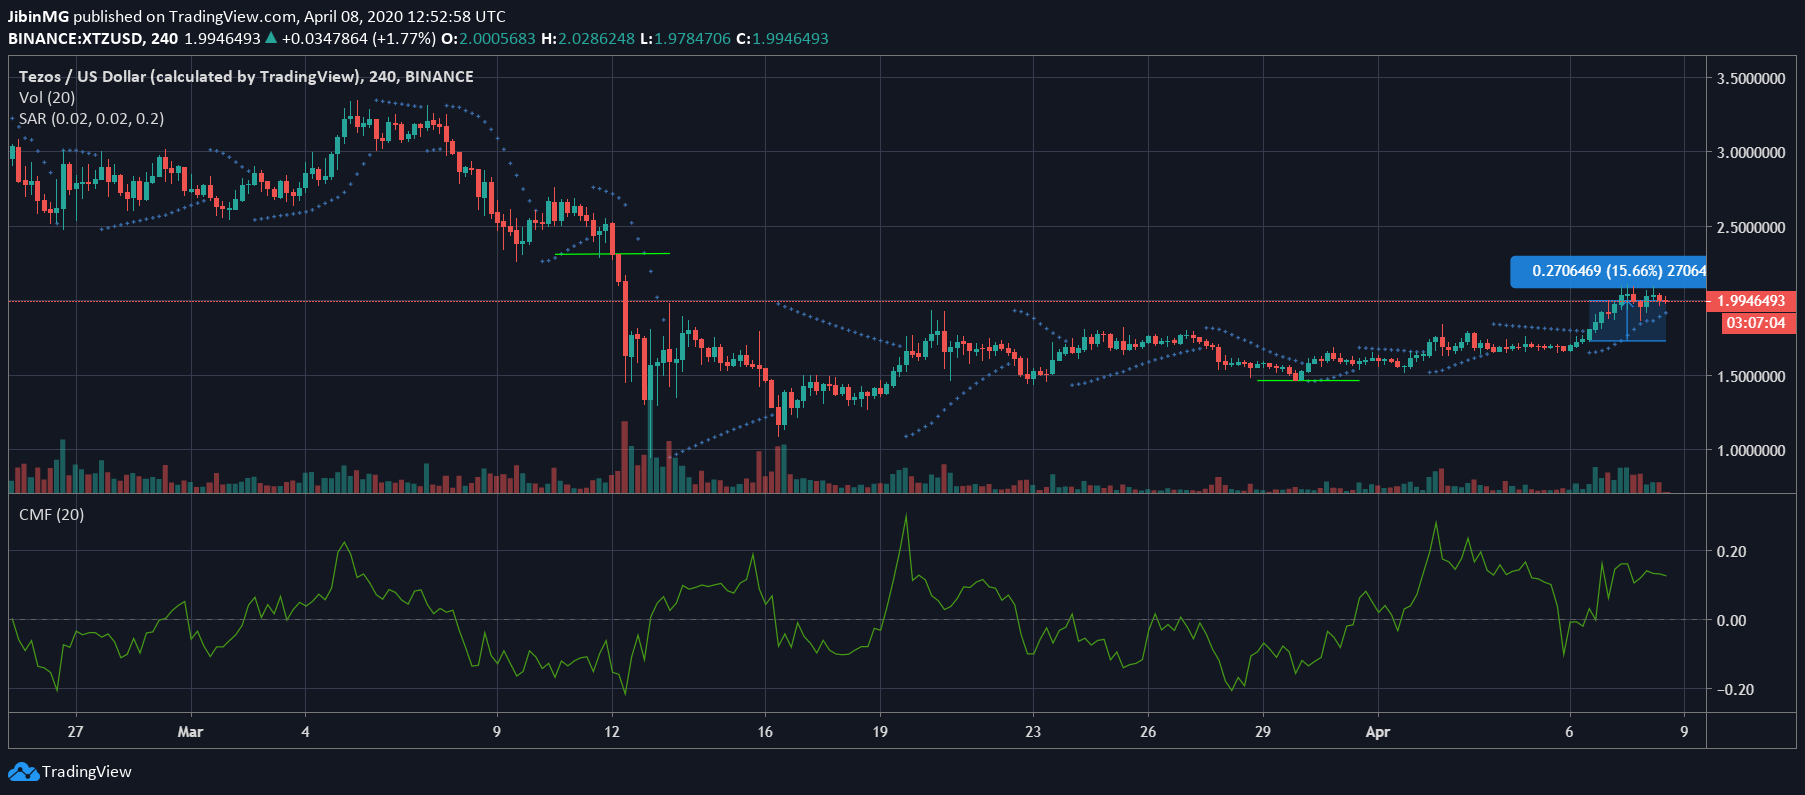
Source: XTZ/USD on TradingView
Tezos, the 10th largest cryptocurrency on CoinMarketCap, has been quite the rage off-late because it was once, one of the fastest-growing cryptos in the ecosystem. However, the market crash in March changed all that. That being said, Tezos hasn’t forgotten how to record gains, however, over the past 48 hours, XTZ surged by over 15%.
On the development side, Tezos made news after a Swiss consortium announced that it will launch Bitcoin on Tezos’ blockchain.
The aforementioned surge in XTZ’s price was reflected by a host of technical indices. While the Parabolic SAR’s dotted markers were below the price candles and implied bullishness, the CMF was above 0 and highlighted capital inflows.
IOTA
Source: IOTA/USD on TradingView
Once a mainstay of the cryptocurrency charts’ top 10, IOTA now languishes at 24th on CoinMarketCap’s charts. At press time, however, the token was doing reasonably well, with IOTA being priced at $0.167. Over the past 48 hours, IOTA had recorded gains of over 12%, before falling again, at the time of writing.
The signals were more mixed with respect to IOTA’s technical indices, however. While the RSI was around the 60-mark, with the RSI just marginally close to the overbought zone, the MACD indicator suggested an impending bearish market, with a bearish crossover on the horizon.
On the development side, the IOTA Foundation entered into a strategic partnership with Trademark East Africa or TMEA.
FTX Token [FTT]
Source: FTT/USD on TradingView
Like most altcoins, FTX exchange’s native token, FTT, has enjoyed an up-and-down 2020. At the time of writing, FTT was priced at $2.70, with the token having recorded a gain of over 7% over 48 hours, before falling again. It must be noted, however, that FTT was very close to its resistance level of $2.81, a level that FTT last touched right before the crypto-market crash on 12-13th March.
The Bollinger Bands on FTT’s charts were holding steady, a probable indication of steady volatility in the market. The Awesome Oscillator recorded some momentum, however, it was observed to be on a decline.

