Stellar Lumens, Cosmos, Enjin Price Analysis: 24 October

The news that Paypal would introduce its users to Bitcoin and Ethereum was considered an emphatic victory by many in the community, with the same propelling the price from $12,200 to $13,100. The on-chain metrics for the crypto-asset had been quite bullish over the past couple of weeks, but breaking news has a way of swaying heads that rationale and metrics don’t.
On the charts, Stellar Lumens and Enjin Coin exhibited the possibility of a drop in value while Cosmos appeared to enter a phase of lowered volatility.
Stellar Lumens [XLM]

Source: XLM/USD on TradingView
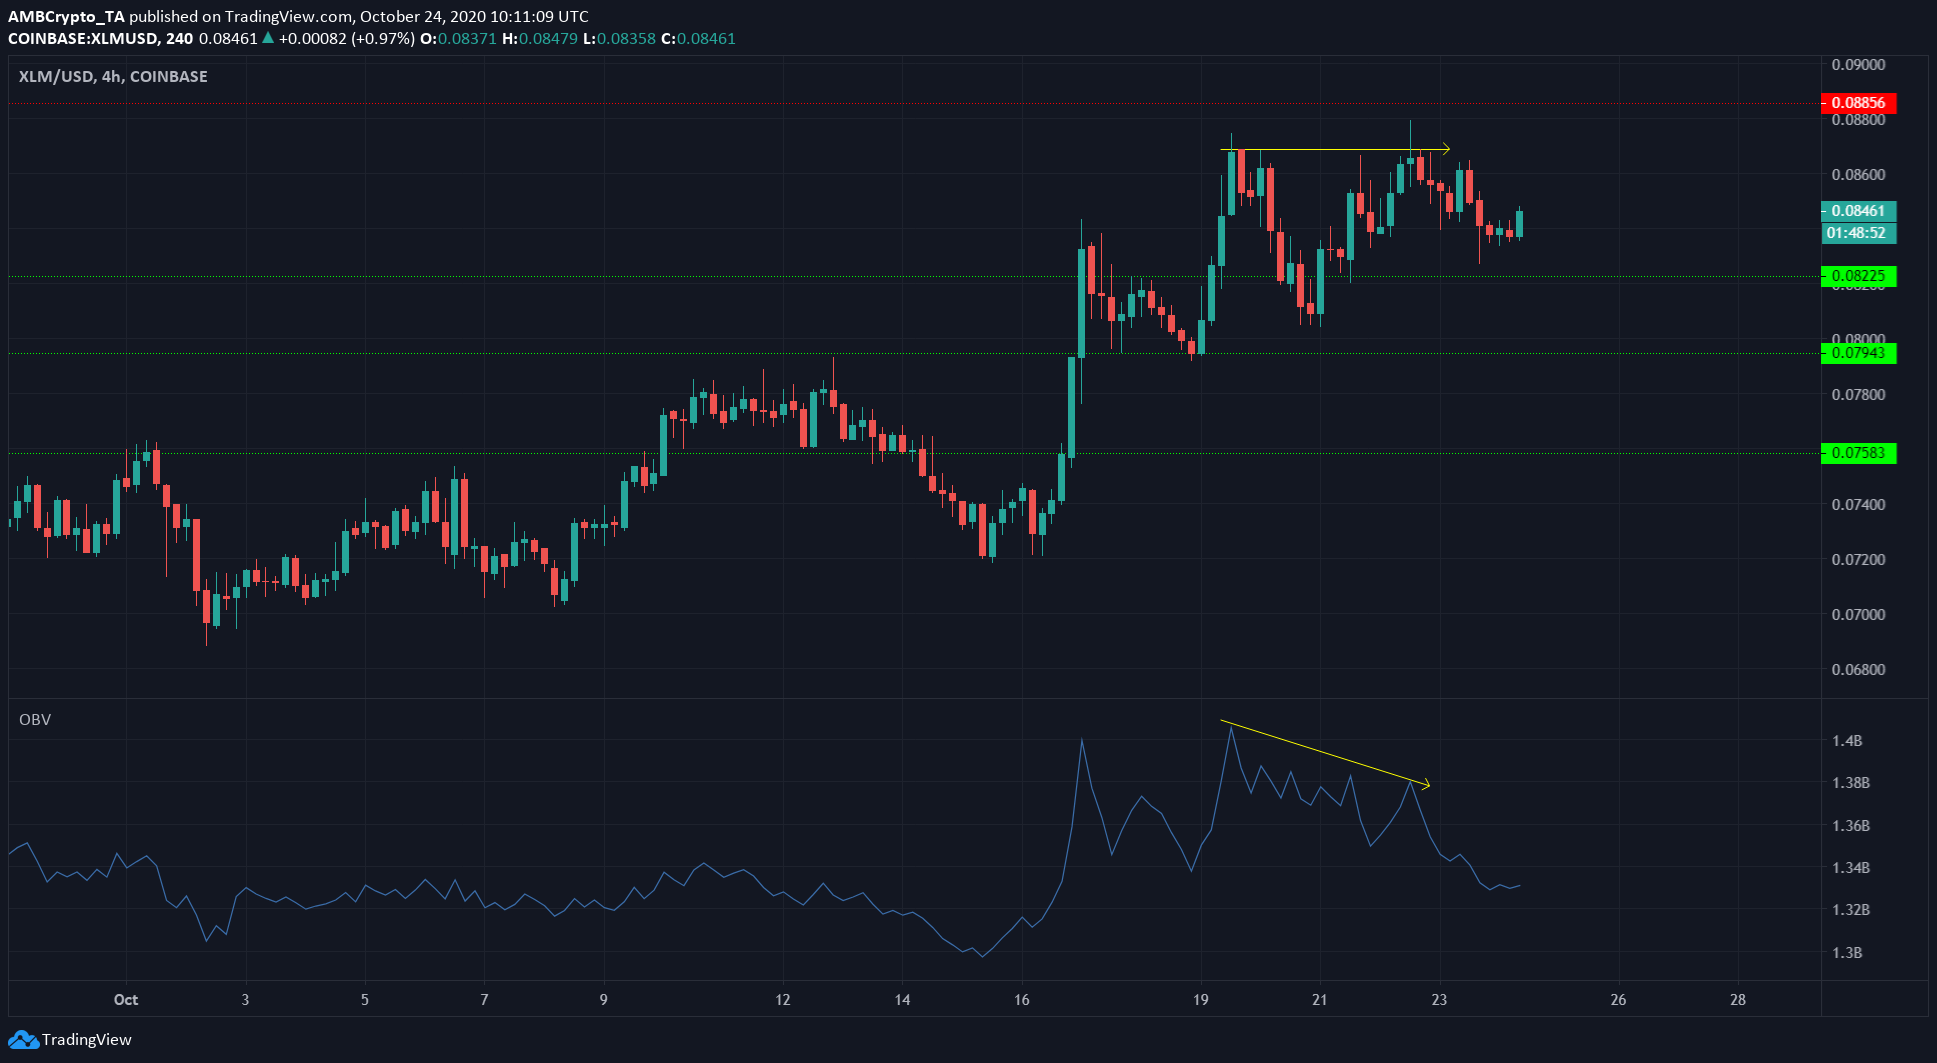
There was a stark discrepancy between the price and the buying volumes on the OBV. As the price formed an equal high, the OBV was sliding down south on the charts.
Such a dearth in buying interest at the local top signified a drop in value for XLM. It had a level of support at $0.082. but it could drop further to $0.079 as well.
A defense of the recently flipped level would be bullish for the crypto-asset in the coming days.
Cosmos [ATOM]

Source: ATOM/USD on TradingView
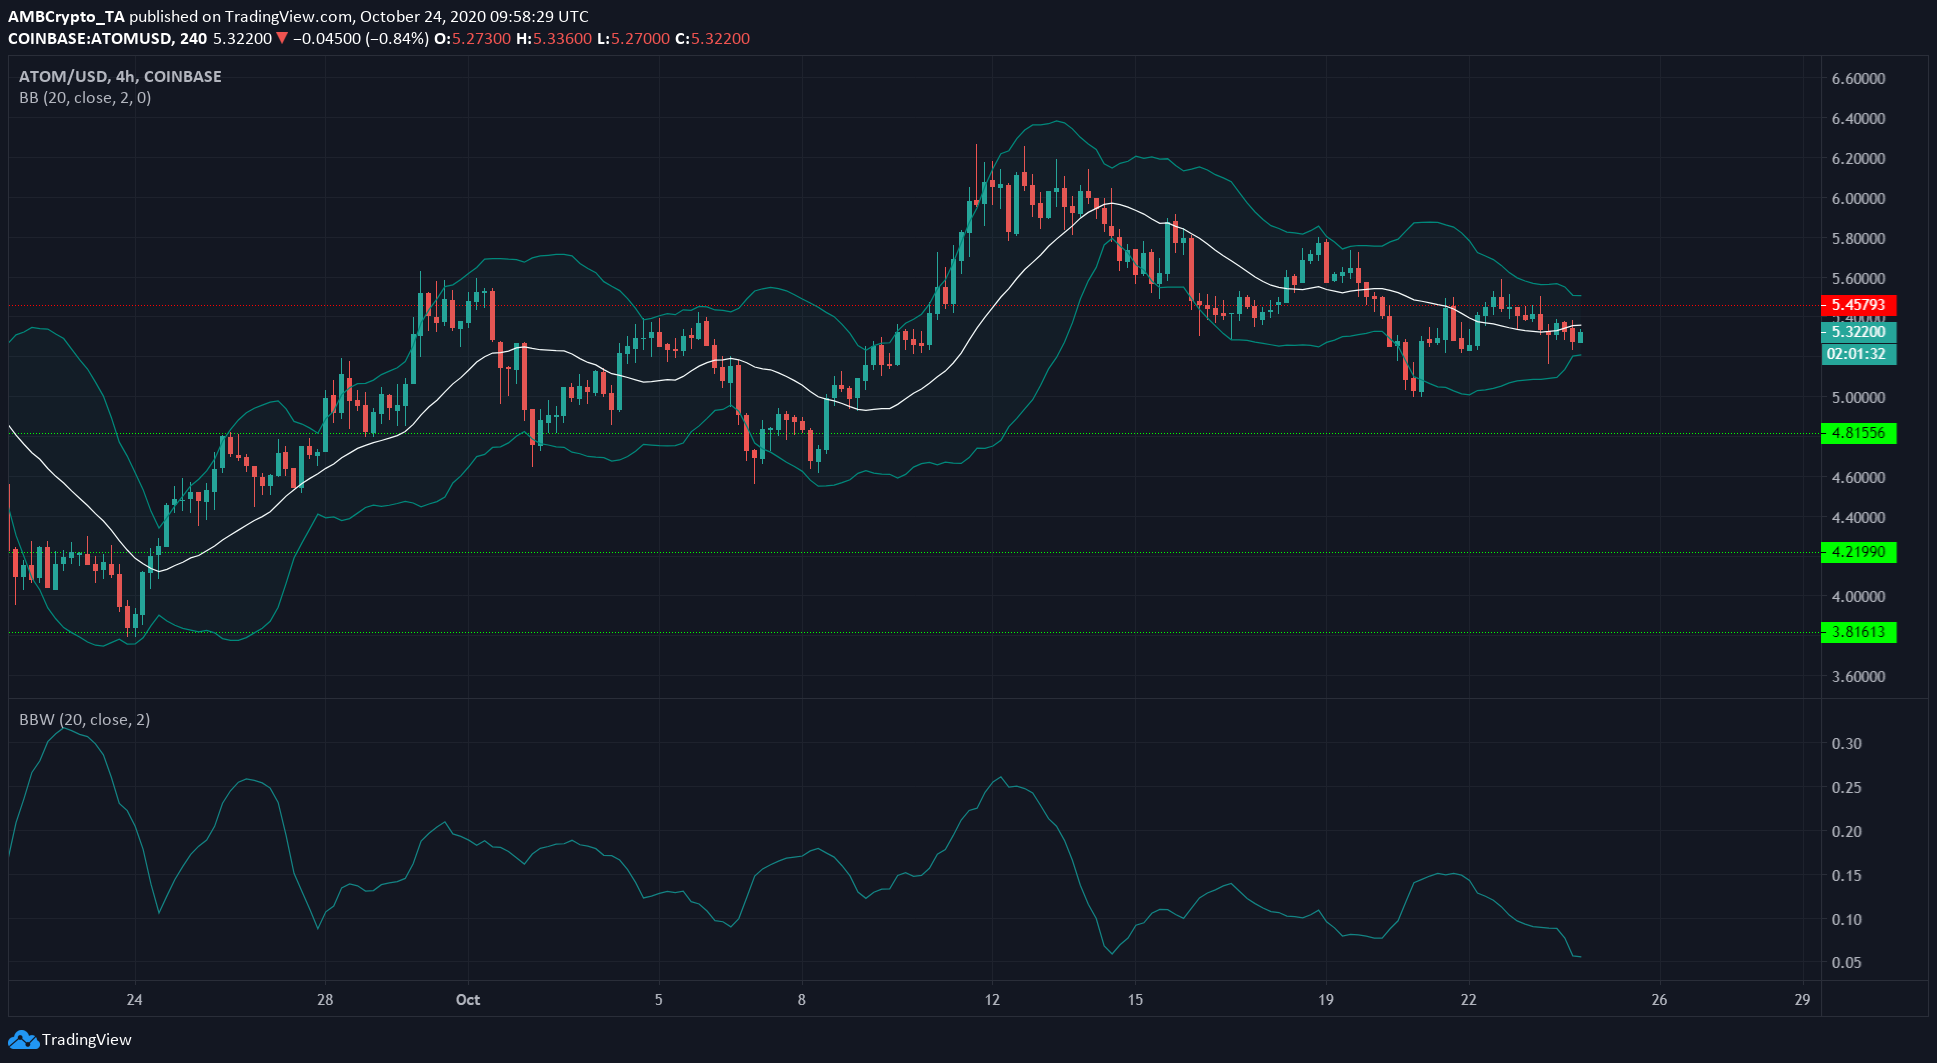
The width of the Bollinger Bands was at its lowest in more than a month as the price appeared to stall just beneath the resistance level at $5.45.
Volatility had been a certainty over the previous week, but at press time, the volatility appeared to have fallen. If a pinch follows, it can be expected to lead to a breakout. The direction could be either way, with width expansion followed by a spike in trading volume needed for confirmation of the bias.
Enjin [ENJ]

Source: ENJ/USDT on TradingView
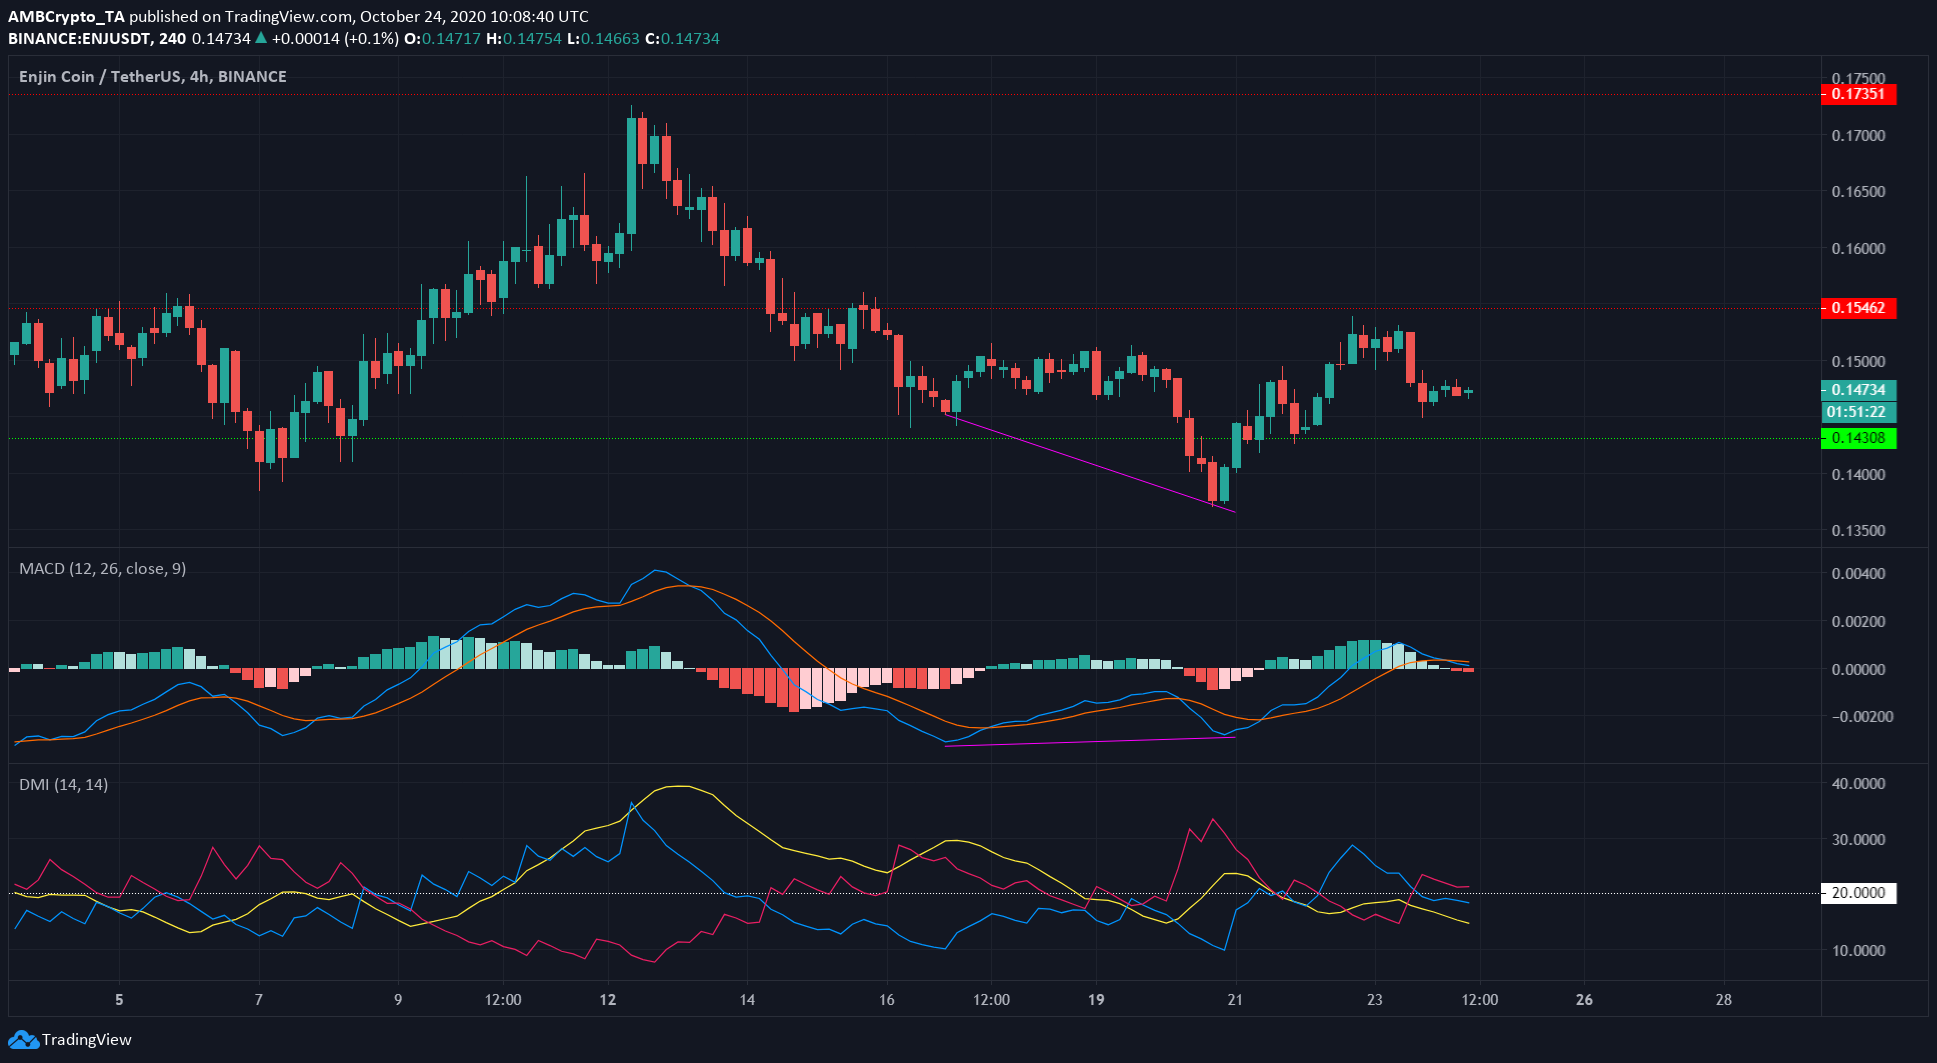
Enjin noted a bullish divergence in the short-term, similar to many other crypto-assets in the space while also registering a surge of 10%.
However, the crypto-asset has been forming lower highs since August, and the trend might be set to continue. When bullish momentum wanes, bears can come by some good entries for short positions.
To highlight the lack of momentum for the coin at the time of writing, we need only look at the MACD and the DMI.
The MACD was marginally above zero while it formed a bearish crossover. This is technically a weak signal, but the more important takeaway is that the momentum indicator showed a lack of momentum.
Similarly, the DMI highlighted the absence of a strong trend as the ADX (yellow) moved further south of the 20-mark.


