
- Activity on Solana increased, resulting in higher revenue for the network.
- Technical indicators suggest that SOL may rise above $60.
In the last 30 days, the Solana [SOL] protocol’s fees have increased by 103%, according to AMBCrypto’s assessment of Token Terminal’s dashboard. For instance, the fees recorded on 22nd November were $131,100.
A few days before that, on 14th November in particular, Solana’s total fees were $99,724.
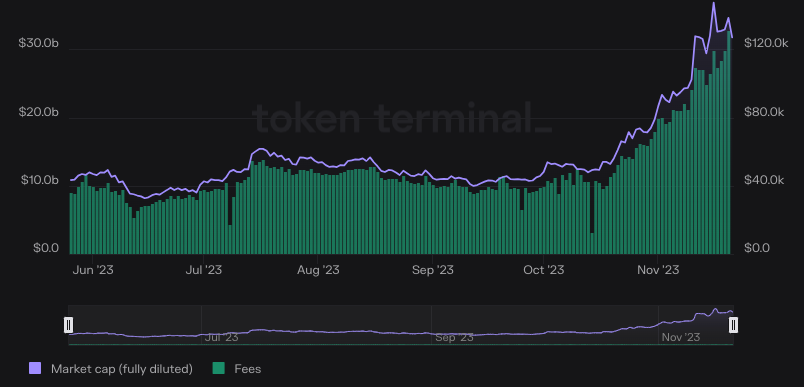
Source: Token Terminal
More fees, no downside
Solana fees are set by the network, and it depends on congestion and historical throughput. About 50% of each transaction fee is burned while the rest goes to the validators processing the transactions.
Despite having cheaper transaction fees compared to Ethereum, the hike in the amount means that there has been a lot of activity on the Solana network.
This assumption was confirmed by the number of daily active users, which increased by 132$ within the same period the fees climbed.
With respect to the SOL price, the broader market recovery helped it reclaim $58.16 in the last 24 hours. But before the hike, MS2 Capital mentioned that the$57.55 level could be decisive for SOL.
According to the web3 venture accelerator, Low-Frequency Trading (LFT) could spell doom for the token, with a possible drop to $46.48. The handle also mentioned that High-Frequency Trading (HFT) could help SOL increase its gains.
#Solana Ecosystem Update$SOL/ $USD 2D?
? – SOL reclaiming $57.55 HTF target?(3.618 fib) would signal upside
⚠️ – $57.55 HTF price becomes LTF resistance – could signal downside to previous MTF?
?- SOL is unable to find support at MTF level $46.48
?- $SOL ?452.9% YTD https://t.co/4VNiMAejME pic.twitter.com/3ePsakwySV
— MS2 Capital (@ms2capital) November 22, 2023
As opposed to HFT, LFT means that few trades are taken over a cycle because traders are opening long-term positions.
On the other hand, HFT signals a surge in the number of large transactions executed in seconds.
SOL looks to the sky
In the end, SOL chose the HFT as the cryptocurrency was characterized by a high order-to-trade ratio. Furthermore, the SOL/USD 4-hour chart buying pressure has been dominating the scenes since 22nd November.
Also, the Relative Strength Index (RSI) was 54.54. RSI reading above 50 is a sign that SOL’s uptrend could continue.
However, the potential price increase would depend on increasing buying momentum.
Should the RSI reading continue to rise, then SOL may retest $62. At the time of writing, the Aroon Up (orange) was 85.71% while the Aroon Down (blue) was 42.86%.
This is a sign that a new uptrend could be underway, and if the Aroon Down falls below 30%, it would confirm that bias.
But that would only be the case as long as the Aroon Up remains above 70%. If that’s the case, bulls may find potentially profitable entries around $58 to $60 while targeting a mid-term upside.

Source: TradingView
Read Solana’s [SOL] Price Prediction 2024-2025
Going forward, the Solana price may continue to build up on its recent recovery.
Should the buying momentum continue to increase, then SOL’s chances of hitting $70 might become more feasible.