- If Solana goes above $59.7, it could kickstart a bull rally.
- Market indicators and metrics remained bearish on the token.
Solana [SOL] experienced a comfortable bull rally last week that allowed the token’s price to reach $67. However, the trend did not last long, as it witnessed a price correction.
But investors should not worry as SOL crossed a key resistance level, which could help the token reach new highs soon.
Is Solana’s bull rally ending?
Solana’s monthly price peaked on the 16th of November when its value reached $67.63. Soon after that, the token’s value started to drop. Though SOL’s value still managed to increase by more than 3% last week, it was well below the previously achieved mark.
As per CoinMarketCap, at the time of writing, SOL was trading at $59.51 with a market capitalization of over $25 billion.
However, the good news was that despite the latest price drop, SOL managed to go above a key resistance level, which could help the token reach new highs in the days to follow.
Bluntz, a popular crypto analyst, recently posted a tweet highlighting that if SOL’s price managed to go above $59.73, the token could initiate a new bull rally.
beautiful low timeframe accumulation break on $SOL.
looks like we just put a running flat correction in and i think we're back baby, new highs next up.
trading this on bybit ?https://t.co/zHX9WYRMOM pic.twitter.com/FMMuR4Ox7o
— Bluntz (@Bluntz_Capital) November 19, 2023
In fact, the token actually did cross that level for a short while in the last 24 hours. But the scenario changed as it again fell under the aforementioned mark. AMBCrypto checked SOL’s daily chart to see whether the token could initiate a bull run in the near term.
As per the Bollinger Bands, SOL’s price remained in a highly volatile zone. Its Money Flow Index (MFI) also registered an uptick from the neutral mark. Nonetheless, the Relative Strength Index (RSI) went down — a troubling sign.
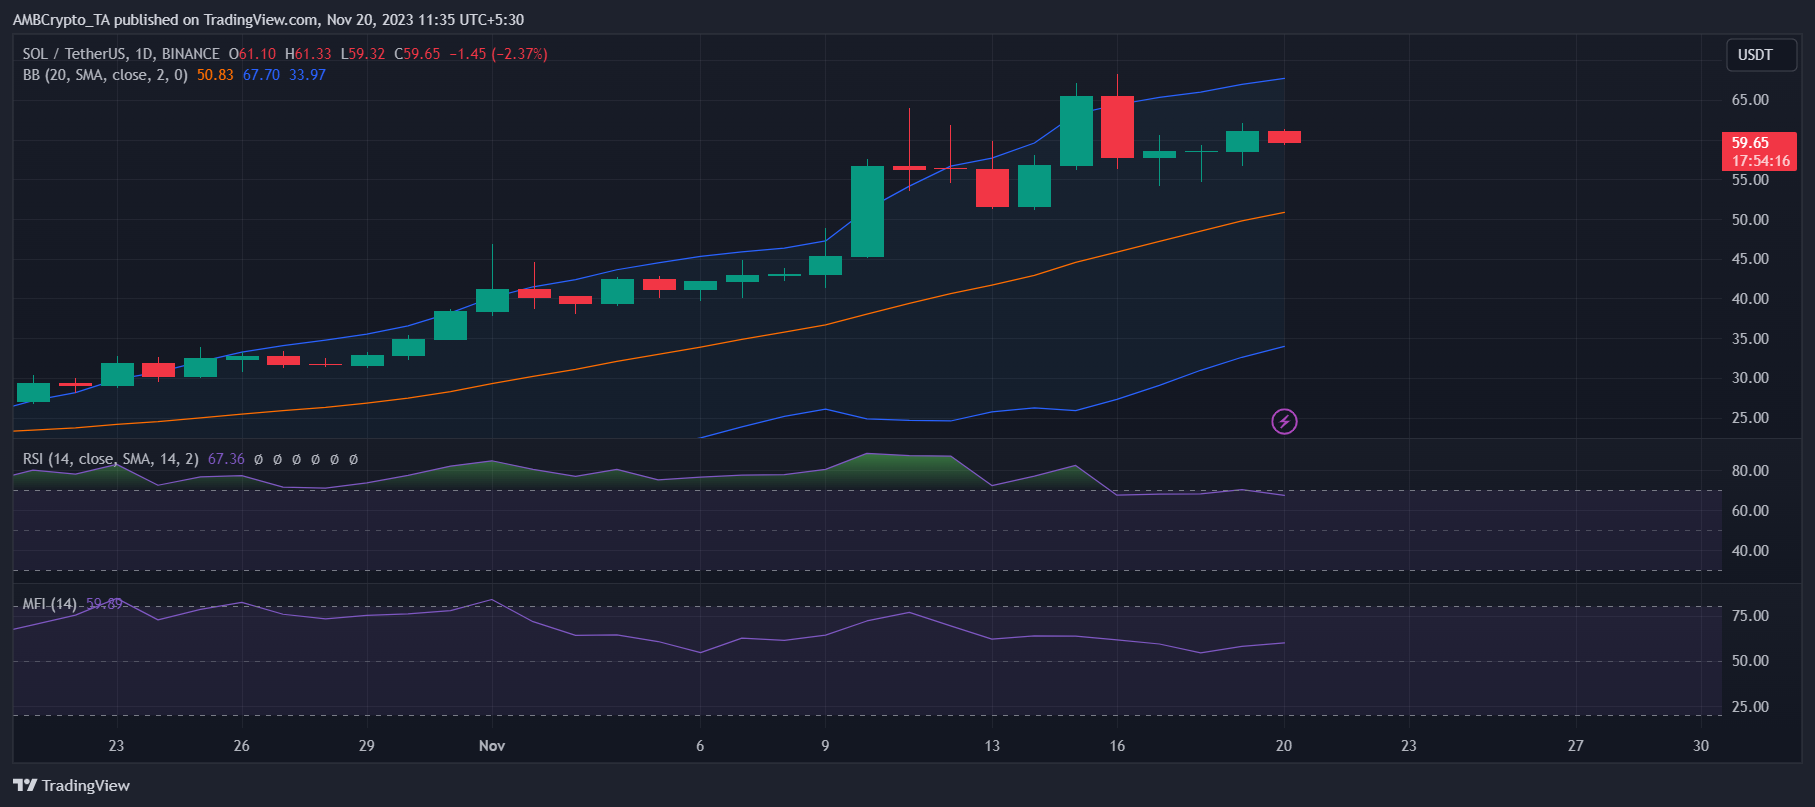
Source: TradingView
Solana’s metrics look bearish
AMBCrypto’s analysis of Santiment’s data pointed out quite a few bearish metrics. Notably, the token’s Social Volume and trading volume declined, reflecting a drop in its popularity.
Negative sentiment around the token was also dominant, as evident from the drop in its Weighted Sentiment. Its Price Volatility 1w also sank, minimizing the chances of an unprecedented price uptick.
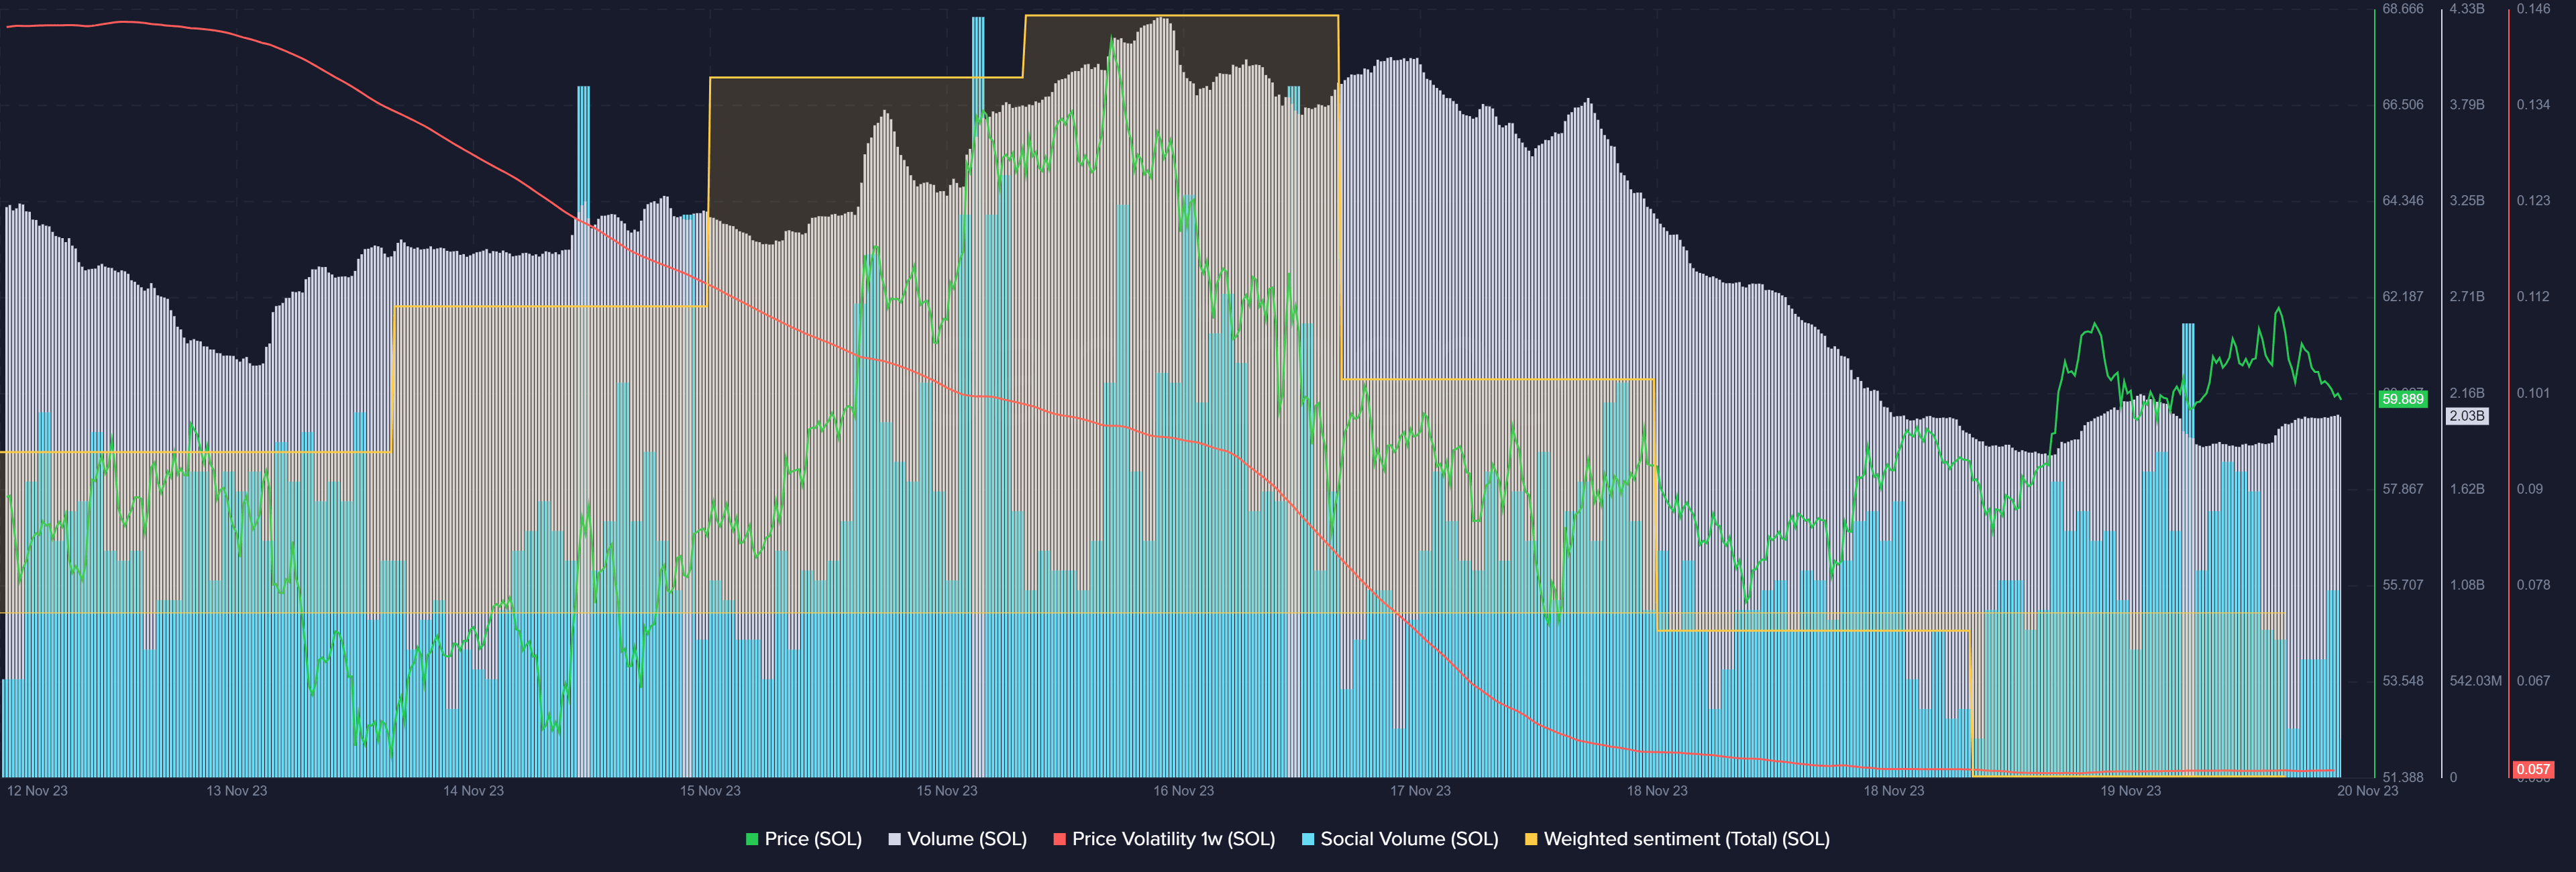
Source: Santiment
Is your portfolio green? Check out the SOL Profit Calculator
Though the metrics were bearish, the blockchain’s network activity continued to rise. When AMBCrypto checked Artemis’ data, we found that Solana’s Daily Active Addresses gained upward momentum.
The same trend was also seen in terms of its Daily Transactions, which have been moving up for the last 30 days.
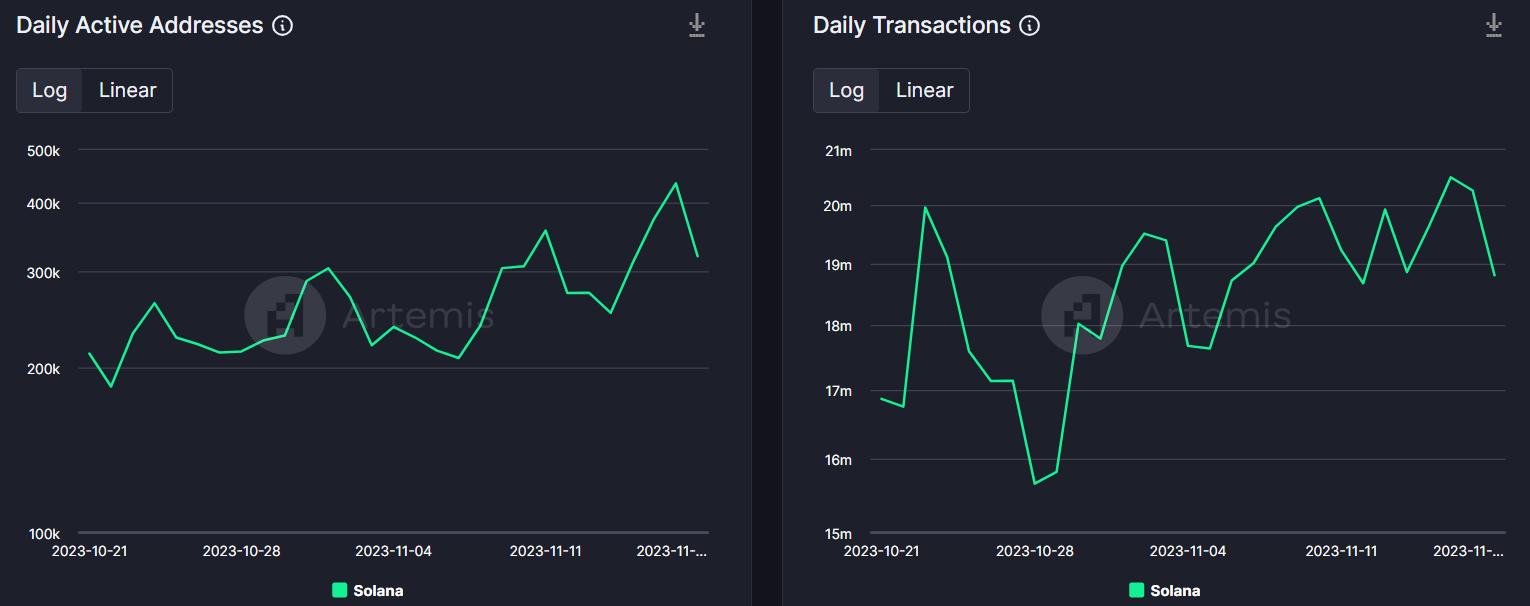
Source: Artemis