Predicting Bitcoin surges using a USDt metric hiding in plain sight

People have been trying to crack the market for as long as trading existed. The more complex the markets have become, the farther people are from trying to figure it out. However, there are few opportunities that often manifest for a brief moment that could favor the tides. Both, the stock market and the cryptocurrency markets have these moments.
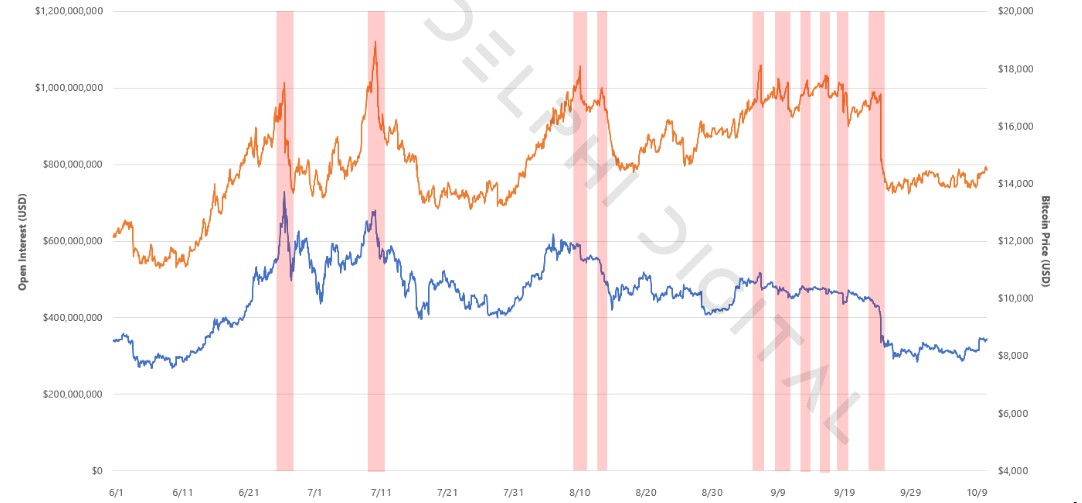
For example, Open Interest, and how the price favored the bears when OI hit a new peak. As mentioned by Delphi Digital in their October 2019 report,
“A selloff ensued each time OI broke above the $1 billion. this first instance was likely coincidental, as it occurred simultaneously with the $13,700 price peak. However, going forward it became almost systematic and self-fulfilling.”

Source: Delphi Digital
Even the above connection withered away as more traders caught on, leading Bitcoin to spend less time as OI hit $1 billion.
Bitcoin’s other connection
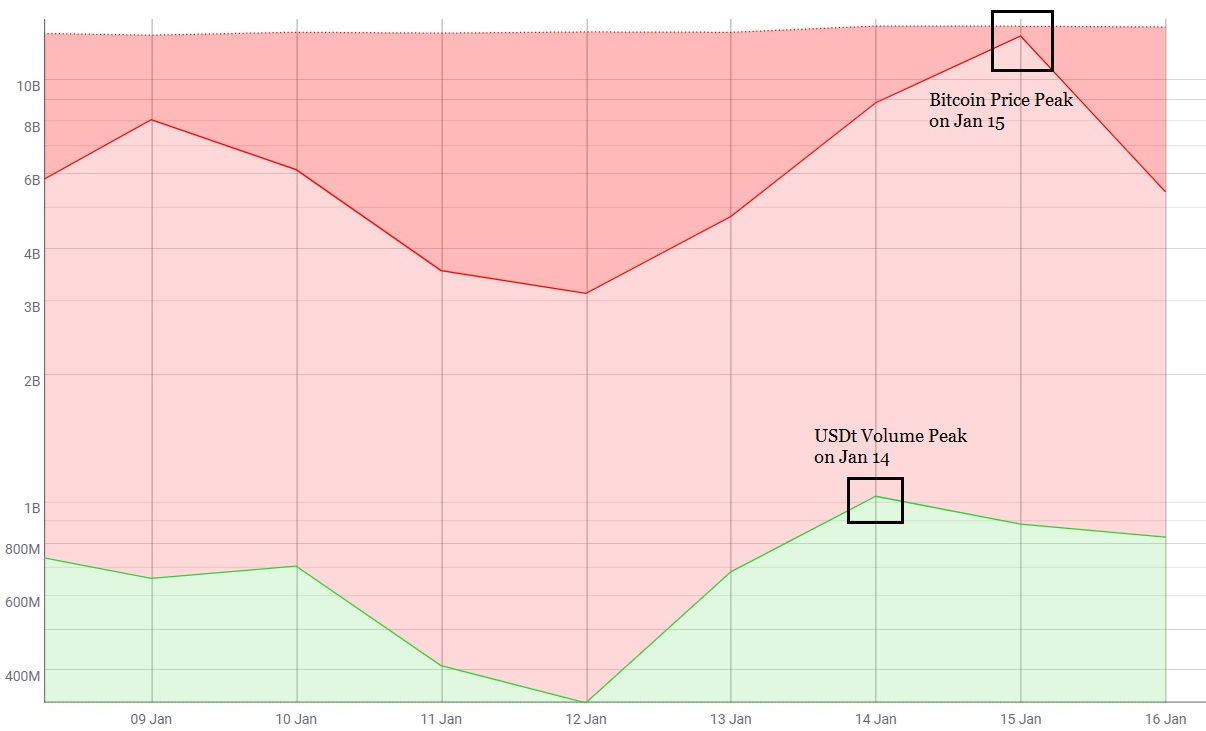
There is a similar yet different connection that can be seen in the price of Bitcoin and the volume of USDt. A connection that became evident after Bitcoin’s January 14, pump. This connection is more palatable mainly due to a simple fact that USDt is the biggest stablecoin. The influx of money into Bitcoin comes vastly from Tether aka USDt, the infamous of all stablecoins.
The connection is such that the volume of USDt peaks prior to Bitcoin price exhaustion; this would mean that the price surge has more upside, hence more profits.

Source: CoinMetrics
As seen above, the price of Bitcoin, evidently, peaked a day after the USDt volume. So, the natural question here would be to know if this method is actually profitable and if so, by ‘How much?’. For the sake of this thesis, we take into account a simple criterion- that the surge in Bitcoin’s price must be equal to 7% or higher.
Approaching the Model
Criteria 1: The surge in Bitcoin’s price must be 7% or higher.
Criteria 2: Following the price surge there should be a peak in the USDt volume as shown above.
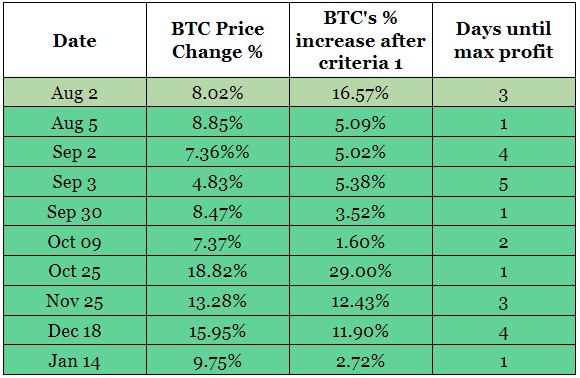
The model has been back-tested with the above-mentioned criteria from August 01, 2019, to January 15, 2020, and has held up without a hitch.
As seen above, 10 data points were across the last six months. Out of the 10 times, August 02, was an anomaly since the price didn’t surge above 7%, hence the cumulative surge of August 01, and 02 has been considered for this case. An average surge of 6% was noticed in Bitcoin after the USDt volume peaked (among the 9 data points). However, the peak surge was 29% on October 25 and a minimum surge of 1.60% on October 09.
Speaking to AMBCrypto, a trader going by the screen name “b.biddles”, explained that this correlation was “situational” and it needed “understanding market context to use for analysis”.
“Most of the time I see the volume spike come with the price hike, not before, which seems like a wave of people FOMO-chasing a pump, causing the pump. Then price pumps after that even with usdt vol declining because of more FOMO’ers chasing after that.”
However, for the times that the USDt volume spikes before the price does, b.biddles explained that it could “signal accumulation”.
There are two limitations to this model – it is a long-only model, meaning, BTC has to pump for the model to be valid and does not apply when the price drops; there isn’t an exit strategy and hence the exits have to be a hands-on approach.
As for exiting the surge, b.biddles mentioned that it could be done using,
“A combo of tighter trailing stop to catch the next pump and wider stop loss as a safety net.”
Results
As mentioned above, the relationship between the USDt and Bitcoin exists solely due to the stablecoin being the on-ramp and is used widely as a trading pair. Moreover, like the BTC price and OI relationship, this might also wane as more people start using it. However, as of now, the average surge observed after the USDt volume peaks is 6% in over 2.5 days.


