Polkadot could face significant levels of resistance in the coming trading sessions that might prove too strong for DOT to surmount. Dash was unable to flip a level of resistance and was likely headed for a drop towards its support. Tron showed strong signs of bearishness in the near-term.
Polkadot [DOT]
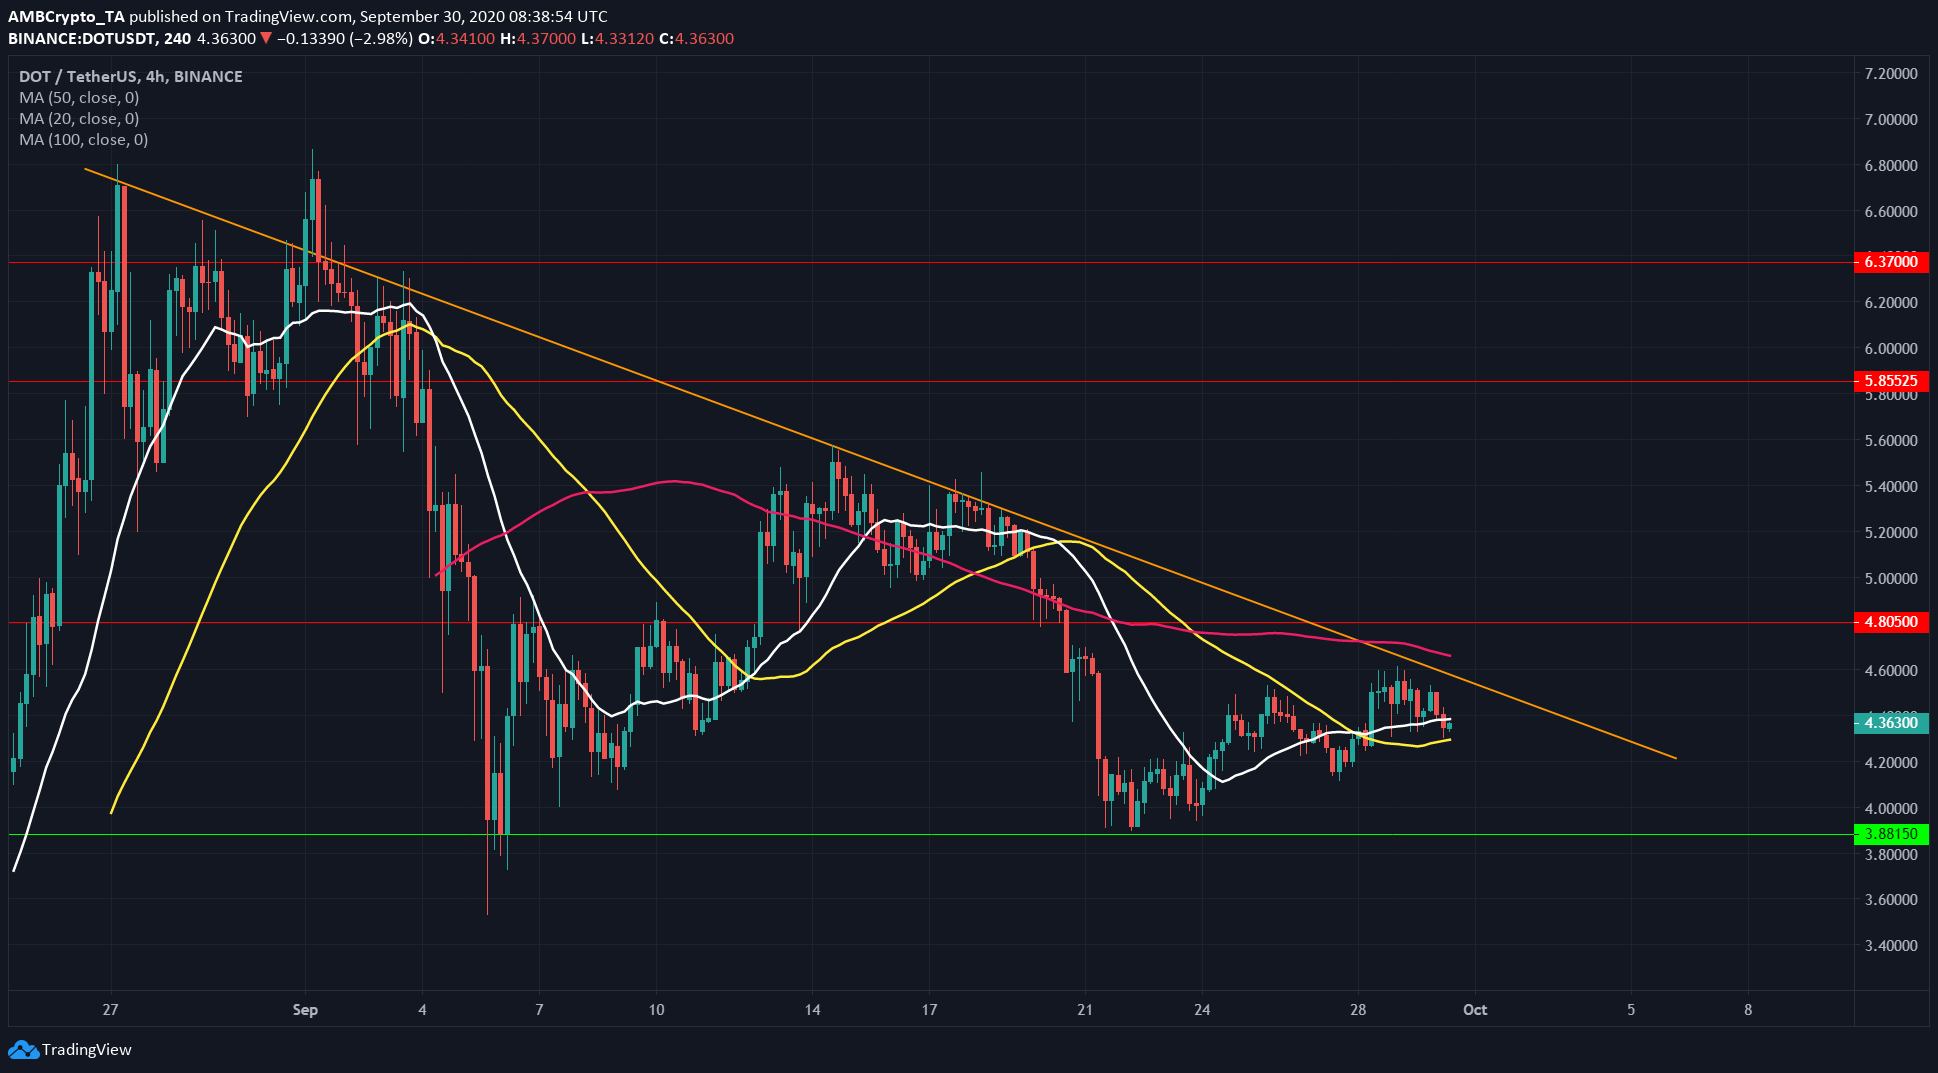
Source: DOT/USDT on TradingView
Polkadot showed some mixed signals. The 20 SMA (white) was moving above the 50 SMA (yellow), indicating a possible flip to bullishness in the short-term. The price was also able to bounce off support at $3.88 and form consecutive higher lows, suggesting a brief uptrend.
However, both were moving beneath the 100 SMA (pink) which signified the presence of a larger downtrend. Apart from this, the longer-term downtrend (shown by the orange trendline) has not been breached and will act as trendline resistance.
DOT had the 100 SMA, trendline resistance as well as resistance at $4.8. Each resistance had a longer time-frame importance, and their proximity, combined with DOT’s lack of momentum recently, indicated that DOT might face rejection at the $4.5 region.
A break above the trendline and moving average would be bullish for the asset.
Dash [DASH]
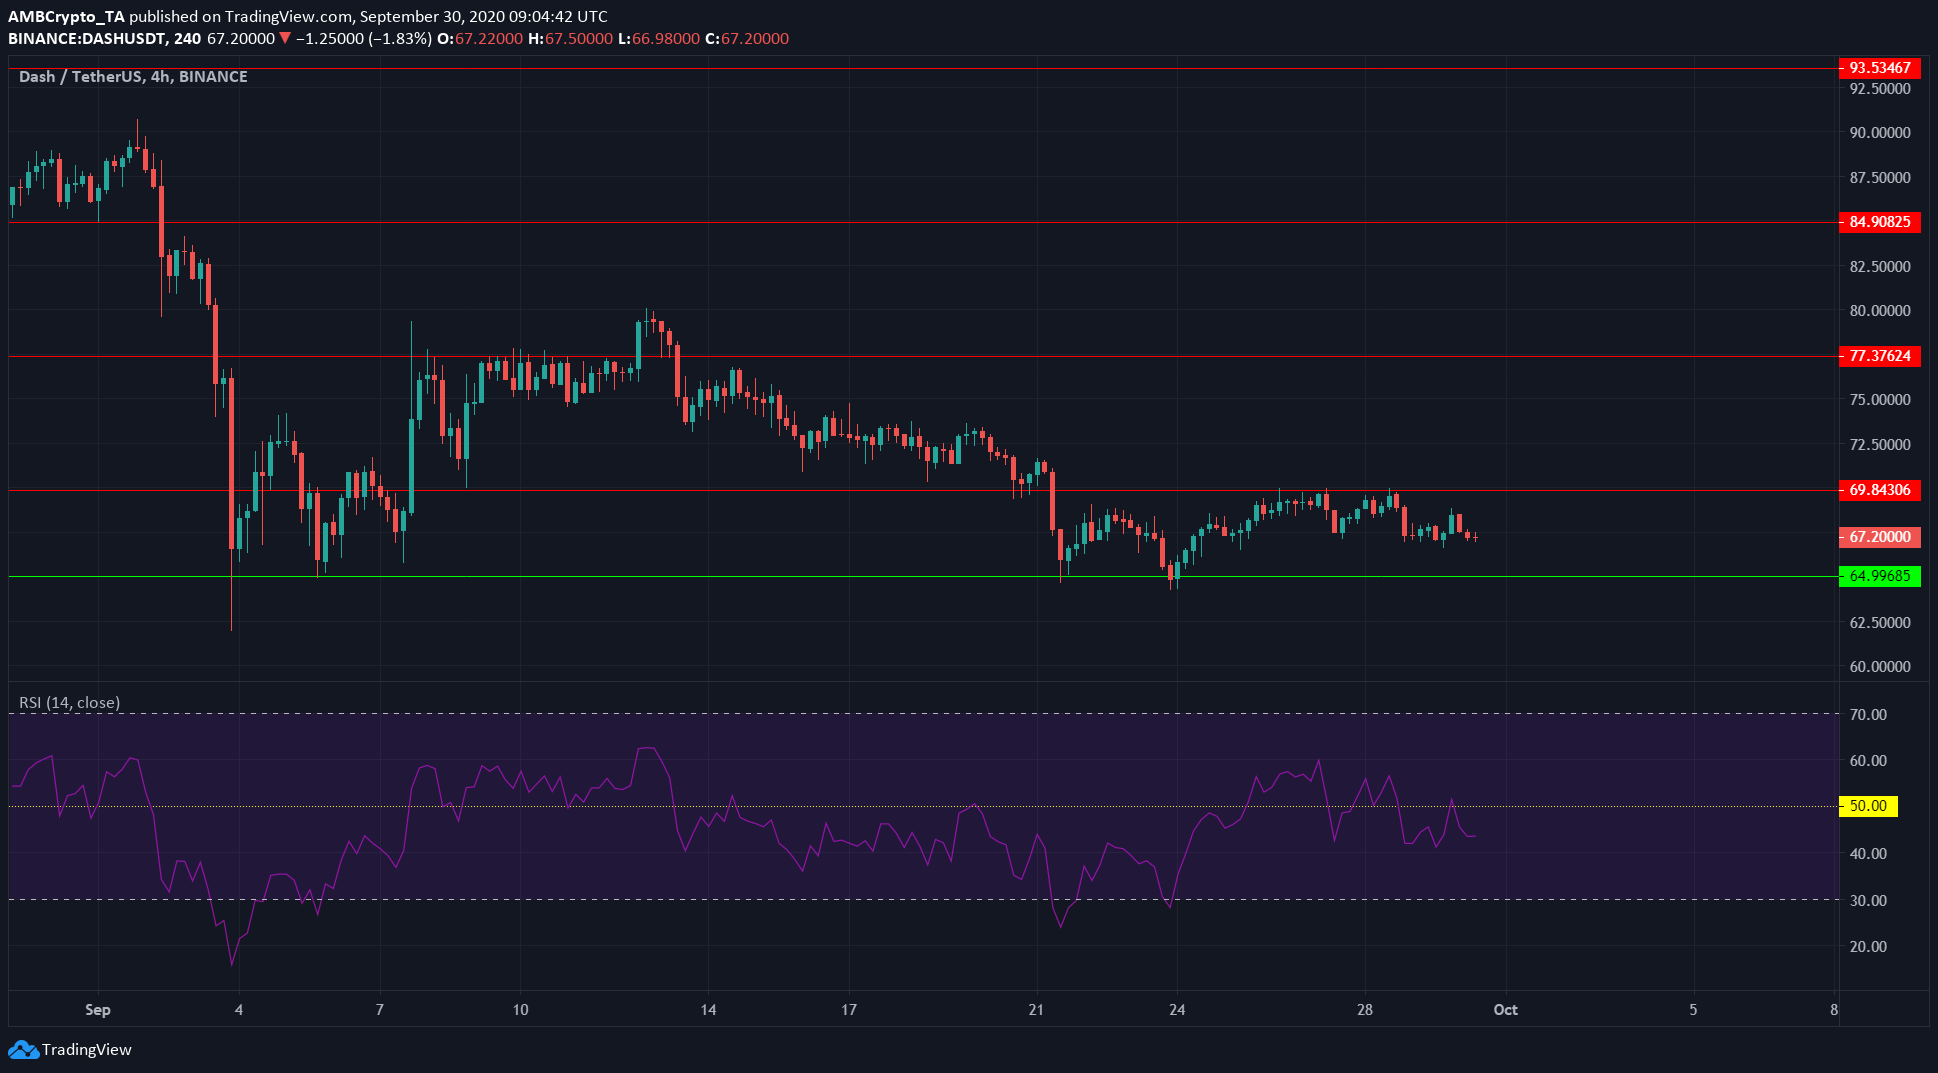
Source: DASH/USDT on TradingView
Dash has been trending downward since the early August highs of $104. On a shorter time-frame, the picture was still quite similar.
DASH tried to breach resistance at the $70 region twice and was rejected both times. The second rejection forced the price to close lower than the previous low. However, there was some evidence for sustained buying pressure on the asset, which indicated that Dash might flip the level of resistance.
The RSI also showed a largely bearish trend for the asset. It has moved beneath the neutral zone for the most part, with brief rallies past it. This was also suggestive of a downtrend, interspersed with bounces.
Unless buyers can force price upward, the longer-term downtrend may win and force the asset beneath support.
Tron [TRX]
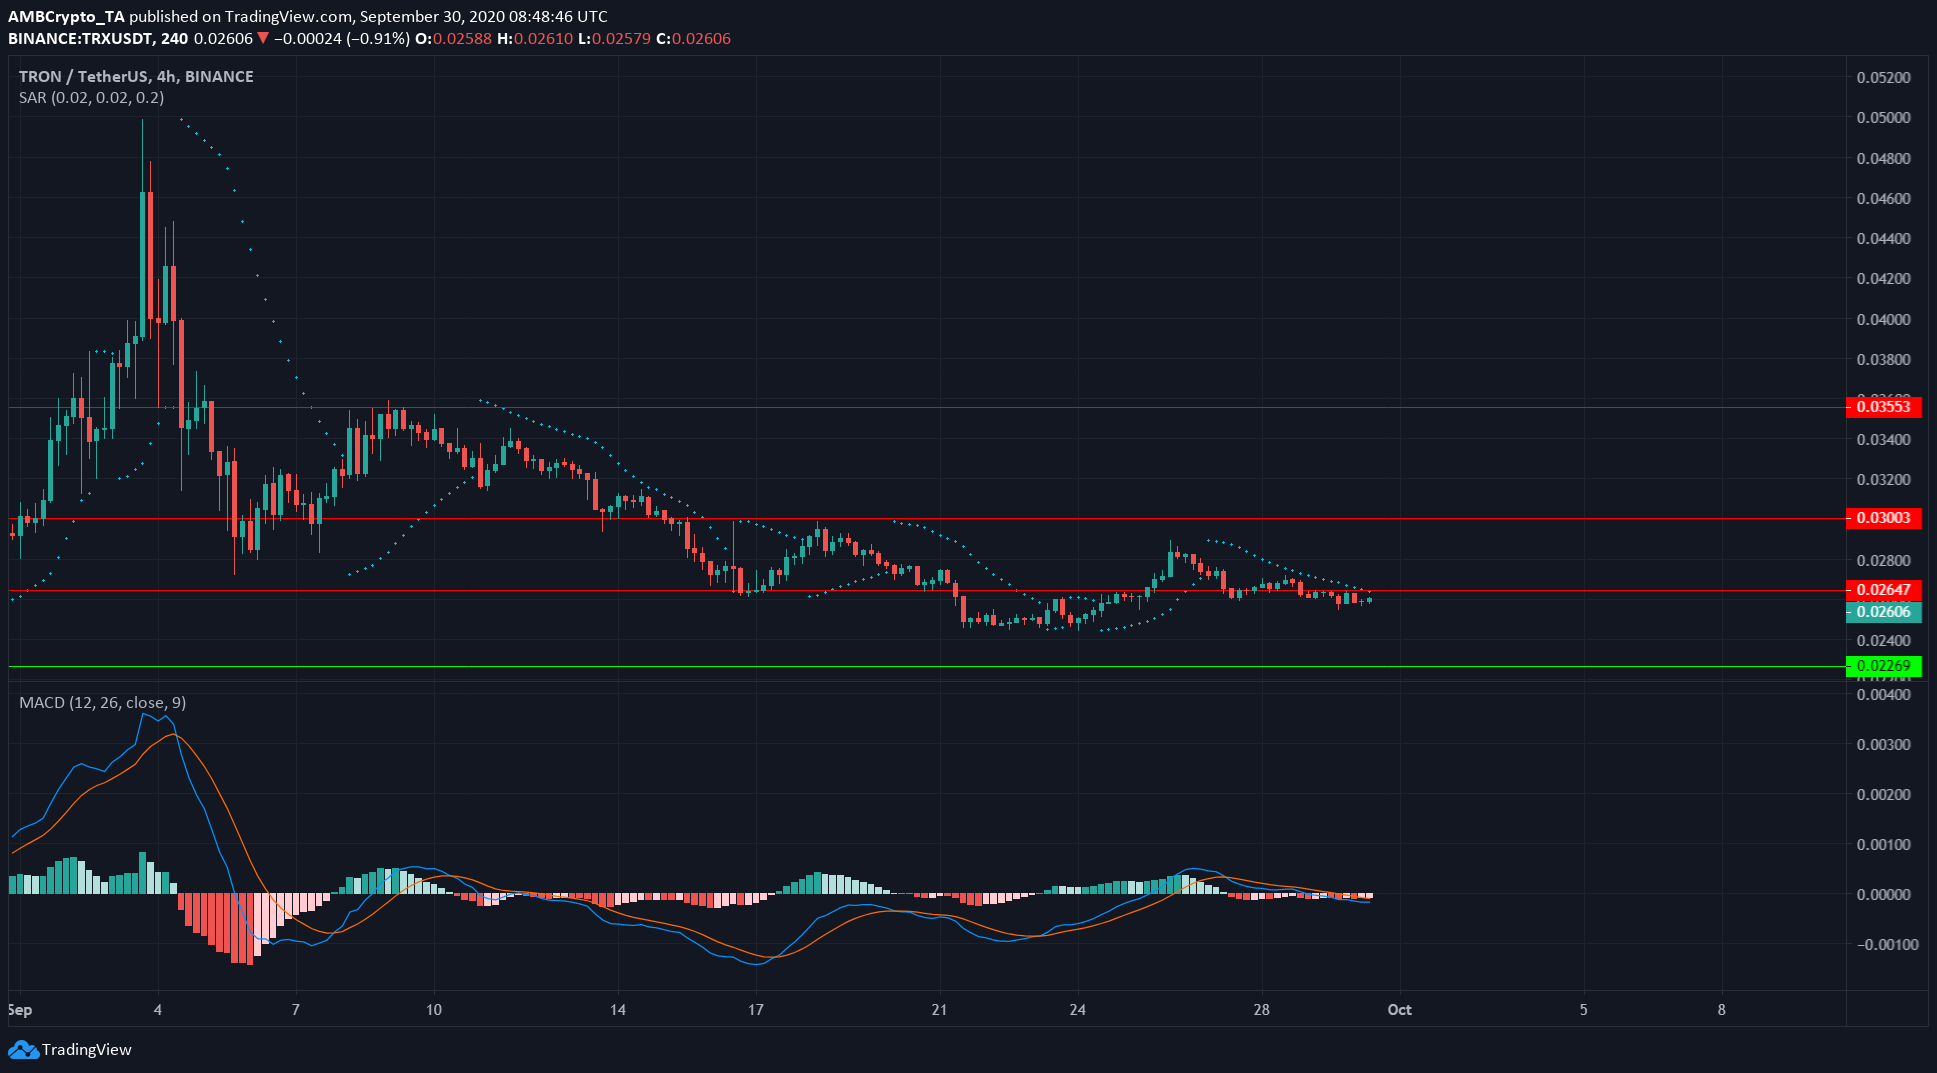
Source: TRX/USDT on TradingView
Tron has been in a steady downtrend since the highs at $0.0499. It had a brief surge from $0.024 to $0.028, but slumped thereafter and was unable to defend the level of support at $0.026.
MACD showed a bearish crossover a few days ago and had moved beneath the zero line, indicating a strong sell signal for the asset. Parabolic SAR also generated a sell signal.
In related news, the Tron Foundation announced it had established a $120 million “Entrepreneurial Ecosystem Alliance Support Program” to support DeFi developers working on the Tron blockchain.