Monero was in a downtrend that could see the crypto-asset lose a level of support to the bears. Polkadot was trading within a relatively tight range over the past few days and could continue to do so over the next few trading sessions. VeChain had a bullish outlook in the near-term as it flipped a level of resistance to support.
Monero [XMR]
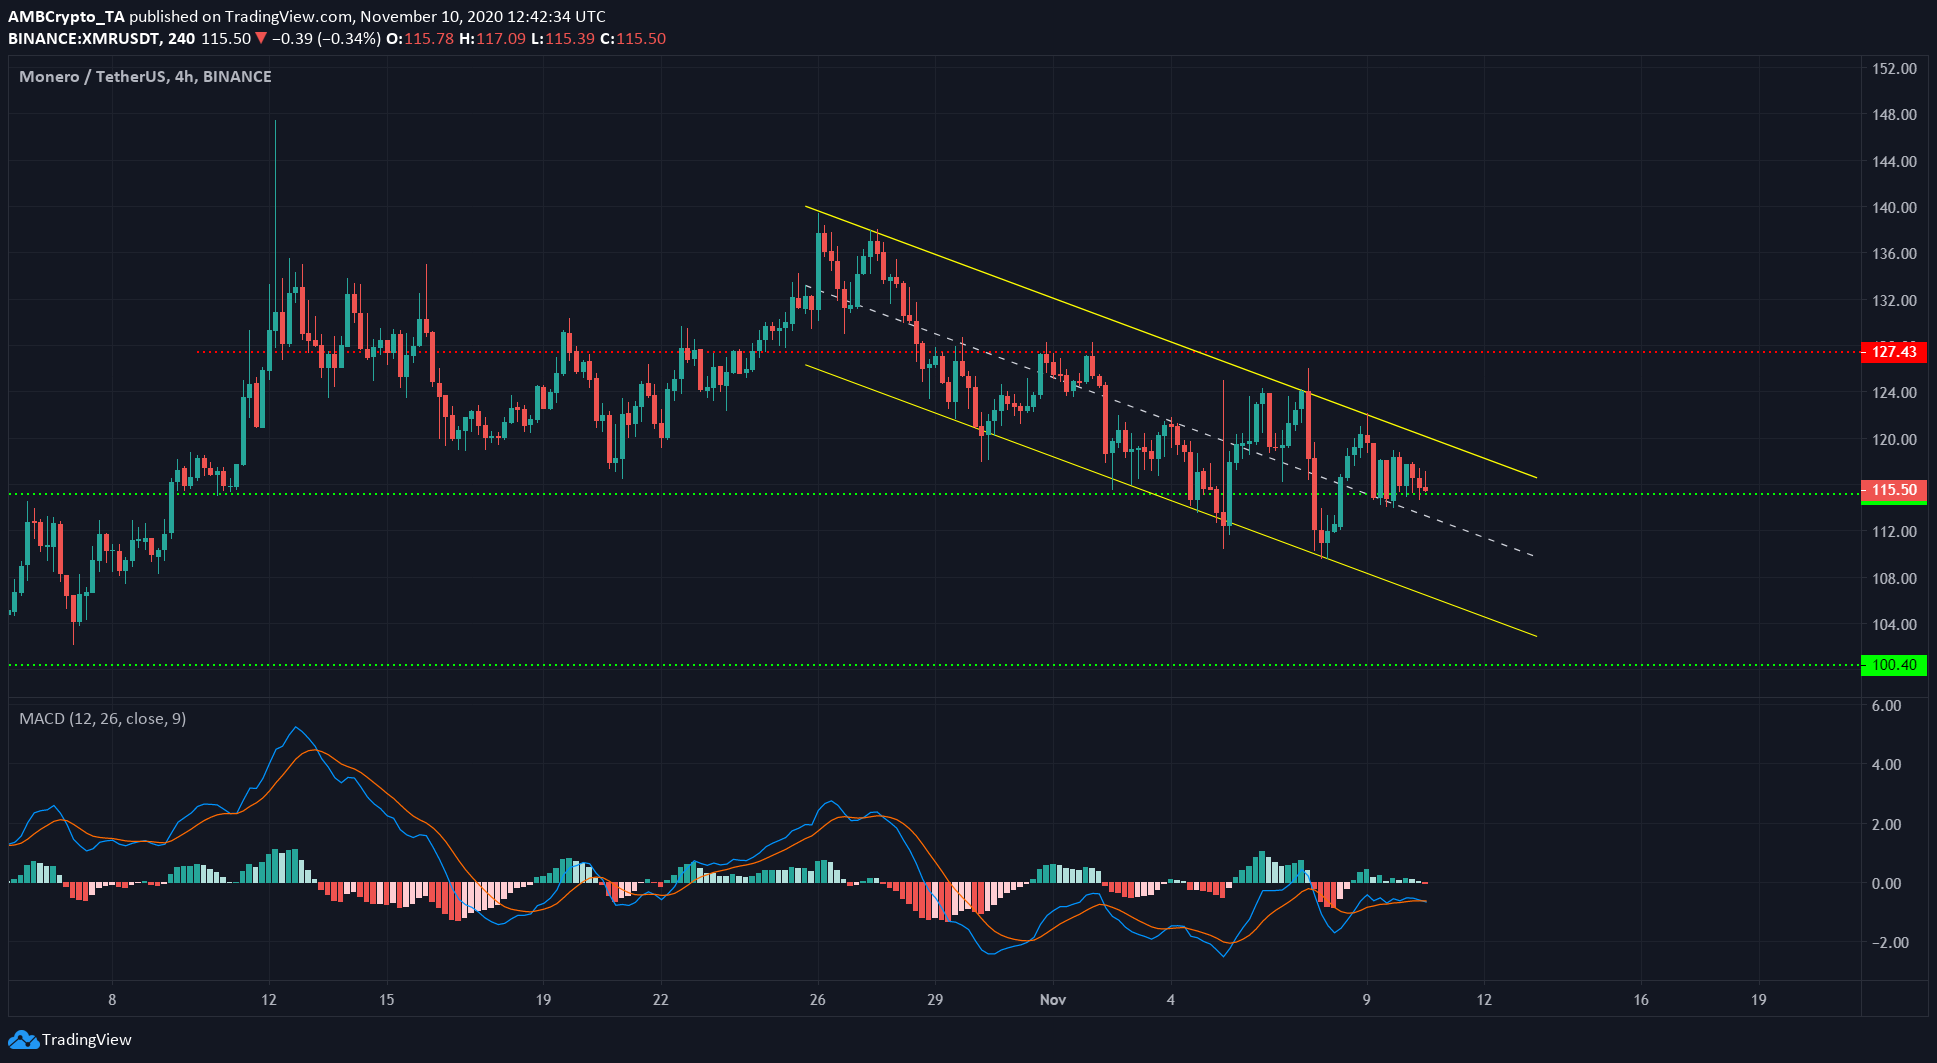
Source: XMR/USDT on TradingView
XMR was trading within a descending channel (yellow) as the bulls fought valiantly to defend the level of support at $115. The downtrend of the past two weeks could see the price drop below support, with a possible retest to flip the level to resistance.
The MACD moved beneath the zero line and threatened to form a bearish crossover. If it did, XMR could find itself on a move to $100 support over the next week.
A shift in sentiment to the bullish would be indicated if XMR closed a trading session above the channel,
Polkadot [DOT]
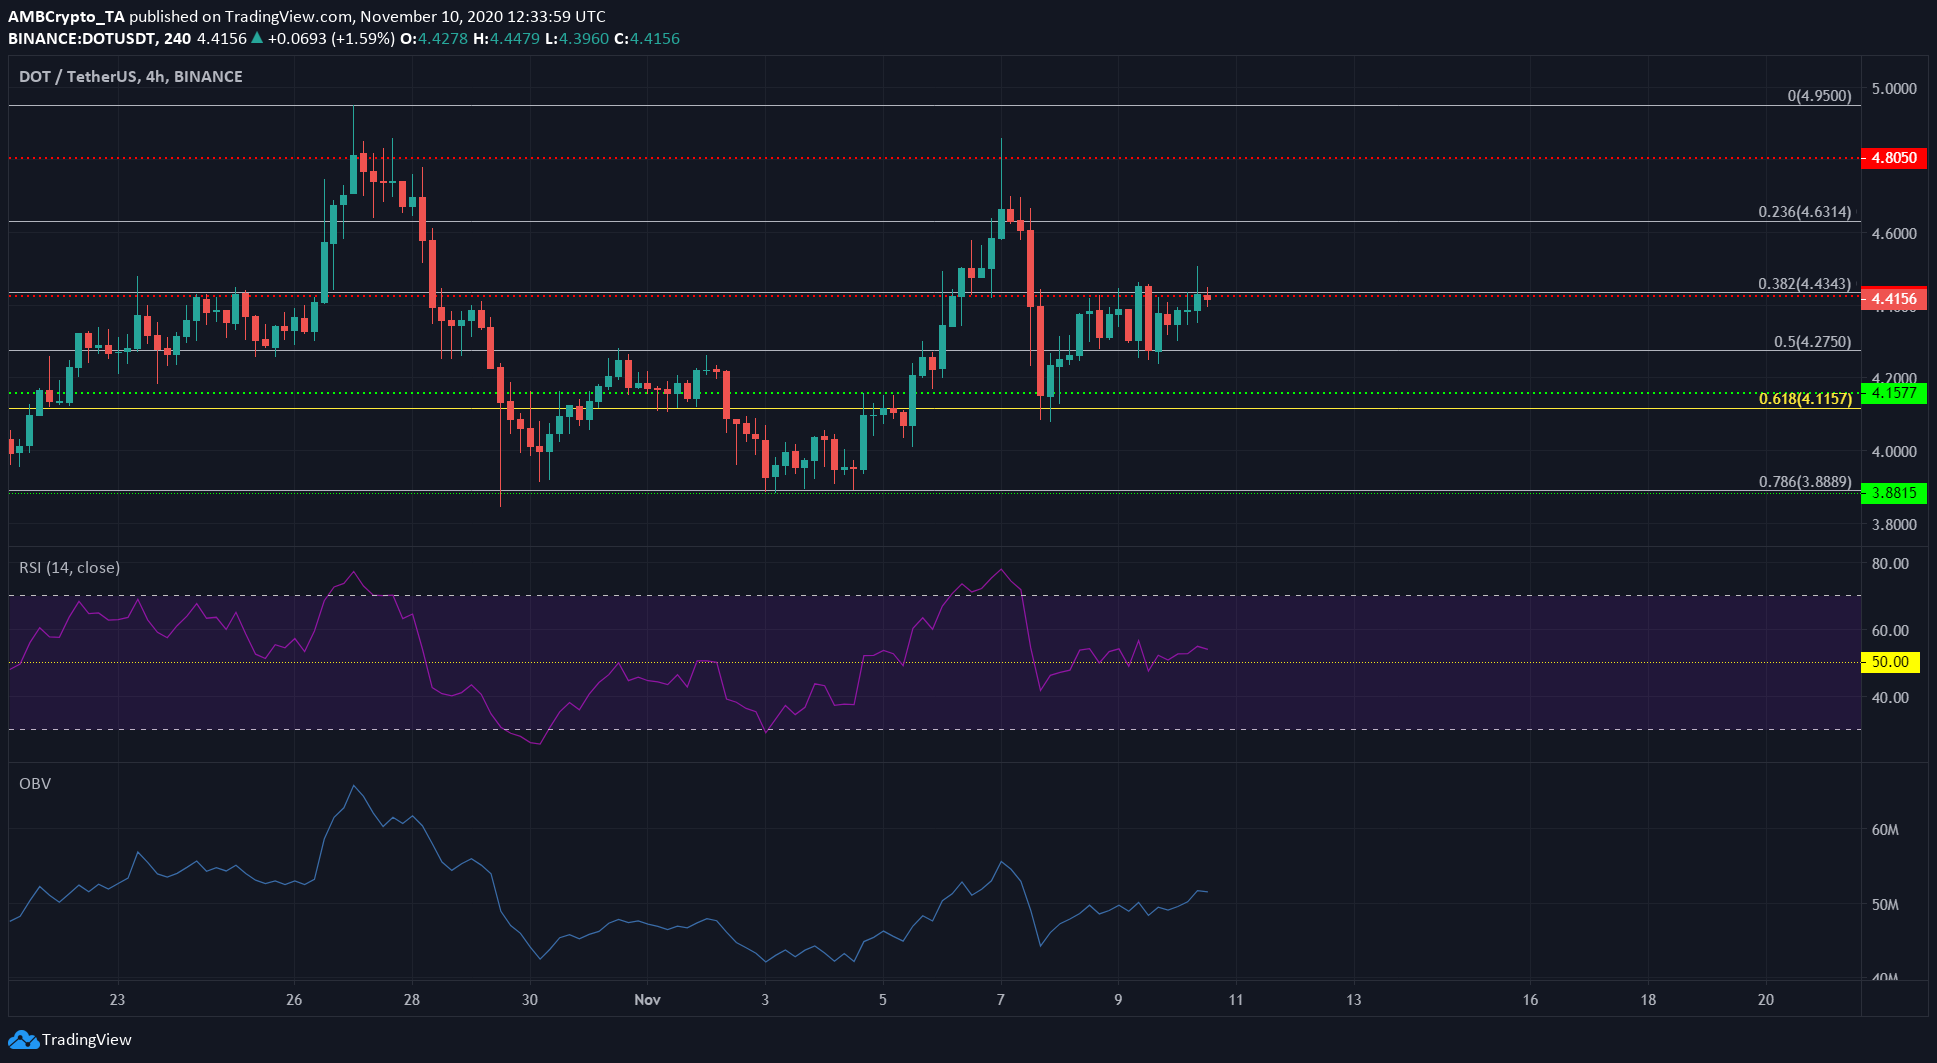
Source: DOT/USDT on TradingView
The short-term play for DOT appeared to be a range-bound movement between the levels at $4.43 and $4.27, which were the 38.2% and 50% retracement levels respectively of DOT’s rise from $3.6 to $4.95.
A break above $4.43 was slightly more likely, as the RSI did not significantly dip beneath neutral 50 in the past few days.
The OBV did not reveal anything new but confirmed that the price action reflected buying and selling volume, and showed no notable divergence.
Until DOT breaks above $4.43 or below $4.27, these two levels can be used to set up scalp trades.
A break above can set an upside target of $4.63, where the next retracement level lies.
VeChain [VET]
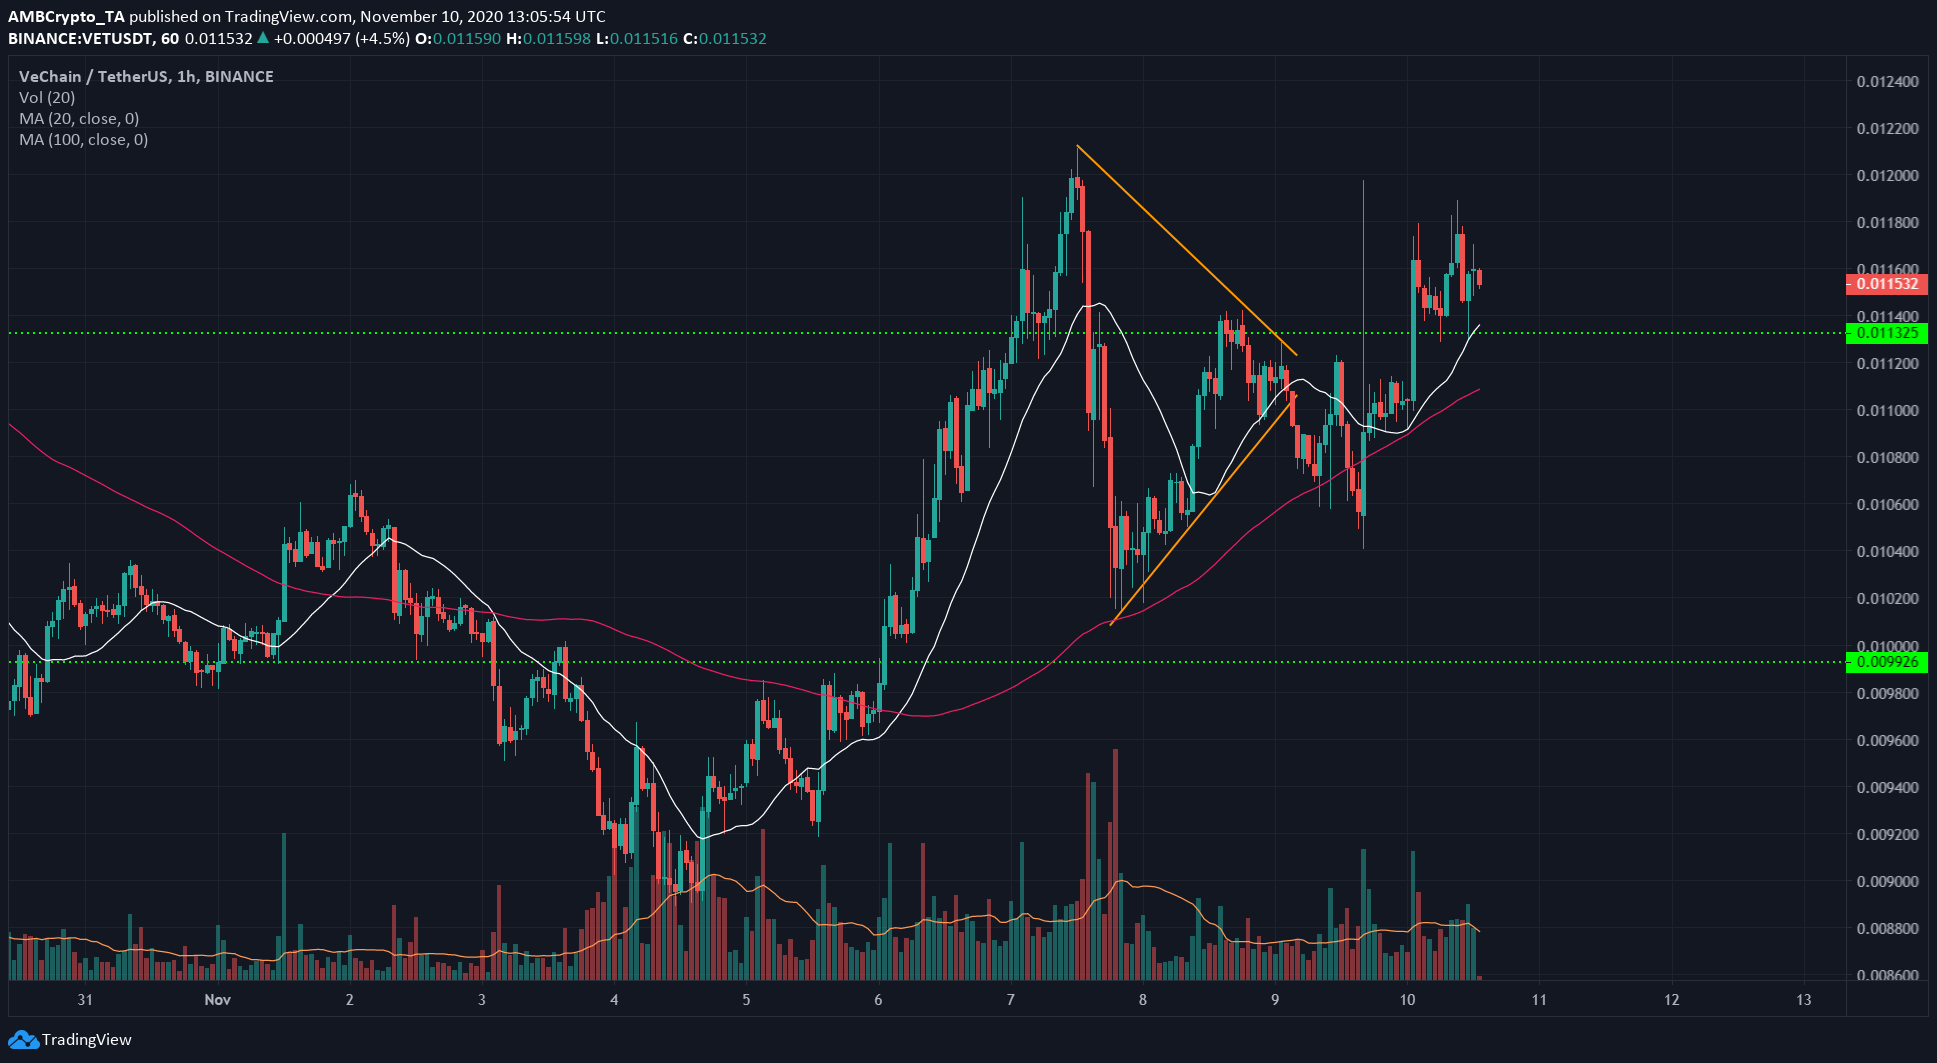
Source: VET/USDT on TradingView
VeChain formed a symmetrical triangle on the hourly chart, appeared to break beneath but reversed itself, and shot upward to flip resistance at $0.011 to support. This fake-out could have been a stop-loss hunting move.
Upon flip of the $0.011 level, VET could be headed higher. Recent gains were made on sessions with good trading volume.
The price was also trading above the 100 and the 20-period moving averages (pink and white respectively) to bullishness both in the past few hours as well as the past week. This could see VET ascend as high as $0.0119, before meeting a zone of supply.