Analysis
Litecoin looks to gain movement with potential inverted bart formation

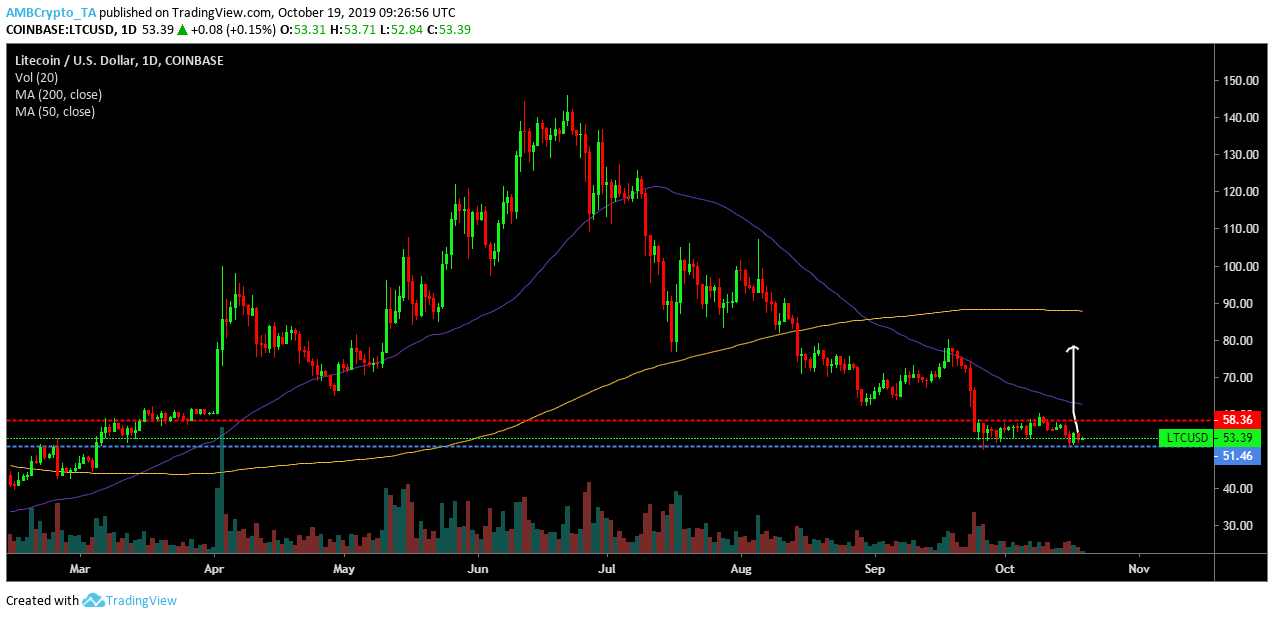
Litecoin was pegged to boom this year, given the historical block reward halving which took place on August 4th; but in contrast, the silver altcoin failed to see its price climb. Soon after, the altcoin saw the formation of death cross on 30th August which is considered highly bearish as it indicated the potential for a massive sell-off.
At press time Litecoin was trading at $53.61 with a minute gain of 0.95% in the last 24 hours. The altcoin had a total market cap of over $3 billion.
1-Day Price Chart

Source: LTC/USD on TradingView
On the 1-day price chart, Litecoin looked to form a potential inverted Bart pattern, as its price has been moving sideways since the massive fall on 24th September. An inverted Bart pattern would be complete if the altcoin manages to see an upward trend and close around the $73.71 mark.
The 200-day moving average has been acting as a resistance for the price since the death cross formation on 30th August. The 50-day moving average has been moving below the 200-day moving average. In a short time, it might act as a support if Litecoin manages to close the inverted Bart pattern.
The volume has been on a constant decline since 24th September which might be a sign for a short-term bullish burst.
Source: LTC/USD on TradingView
MACD line has been moving above the signal line since 7th October, suggesting a dominant bullish sentiment, leading way to a belief that one might see an uptick in Litecoin’s price if it managed to close inverted Bart pattern.
Conclusion
Litecoin might see a bullish bust in the short term with a potential inverted Bart pattern formation, the 50-day moving average might act as a support for the altcoin if it manages to close the inverted Bart. MACD indicator suggested bullish sentiment was dominant.

