
The cryptocurrency market has been registering bullish price action since the price pump of 25 October, a pump which saw Bitcoin and major altcoins register double-digit gains. Litecoin, which has been struggling since its block reward halving and had no support for its prices at that point, also gained a new lease of life due to that pump which was led by Bitcoin.
At press time, Litecoin was trading at $59.49 and had registered a price growth of 2.21% on the 24-hour chart. The short-term movement of the altcoin formed a bullish pattern, a breach from which would push its prices further into the green.
1-Hour Price Chart
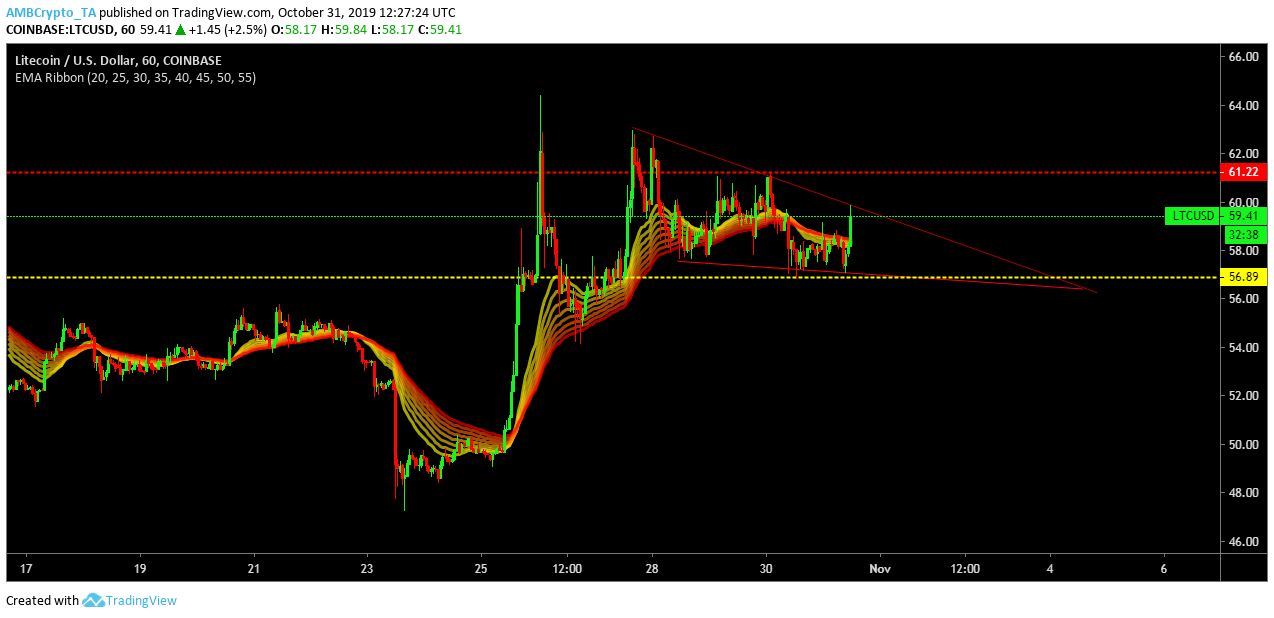
Source: LTC/USD on TradingView
On the 1-hour price chart, Litecoin formed a falling wedge pattern that was characterized by the formation of lower highs meeting at $62.91, $61.22 and $59.94. The lower lows formed at $57.51, $57.05 and $56.80. Formation of a falling wedge pattern is considered bullish as a breach from the pattern often occurs in the upward direction, suggesting that Litecoin looked bullish in the short-term.
The EMA Ribbon acted as a support for price candles from 25 October to 30 October, and then it acted as resistance for a short while, before it was moving again to act as a support.
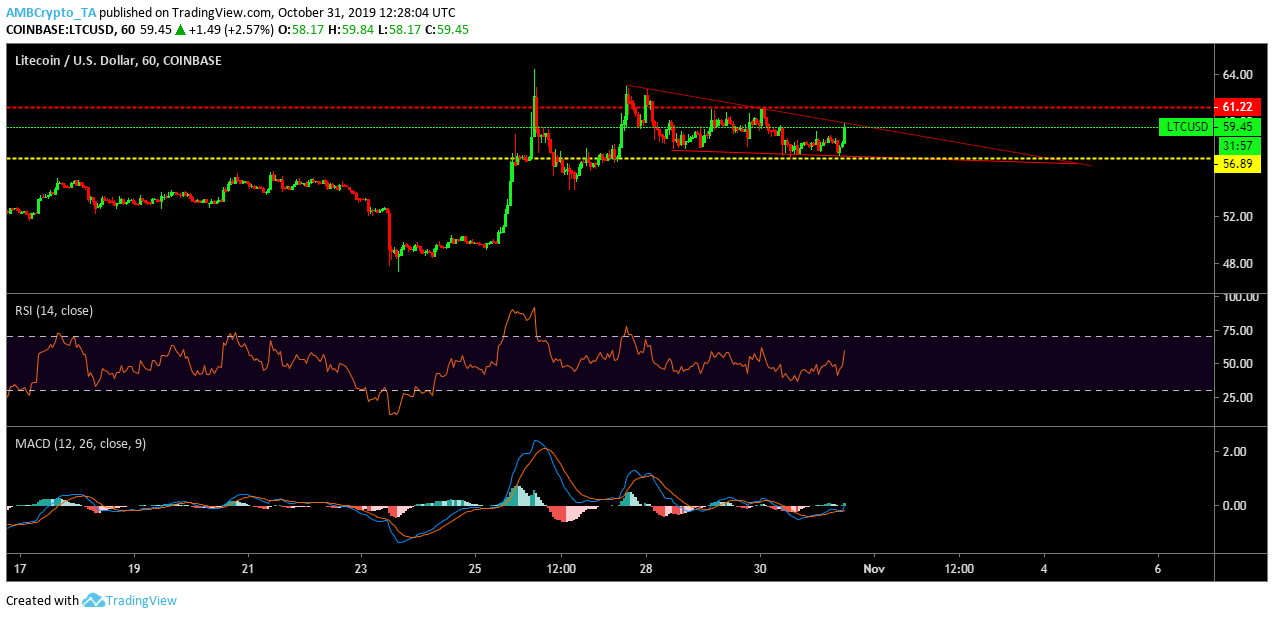
Source: LTC/USD on TradingView
The RSI indicator suggested that selling pressure rose sharply earlier today, but buyers took control of the market towards the end of the day. The MACD indicator also looked bullish as the MACD line has remained above the signal line since the bullish crossover on 30 October.
Litecoin may breach the pattern in the coming week, a breach that might push its price above the $60 mark.
Conclusion
Litecoin looked bullish on the 1-hour price chart as it formed a falling wedge pattern. Key technical indicators supported the bullish case, with the EMA ribbon acting as support while the RSI suggested that buyers had an upper hand. Further, the MACD indicator also looked bullish.