Analysis
Litecoin’s falling wedge pattern calls for renewed optimism
Litecoin’s price has continued to suffer heavy downside pressure and failed to post necessary gains above the key $55-level. According to CoinMarketCap, the silver crypto was trading at a price of $53.56 after a minor surge of 0.16% over the past 24-hours, at press time.
Falling Wedge Pattern depicted bullish prominence

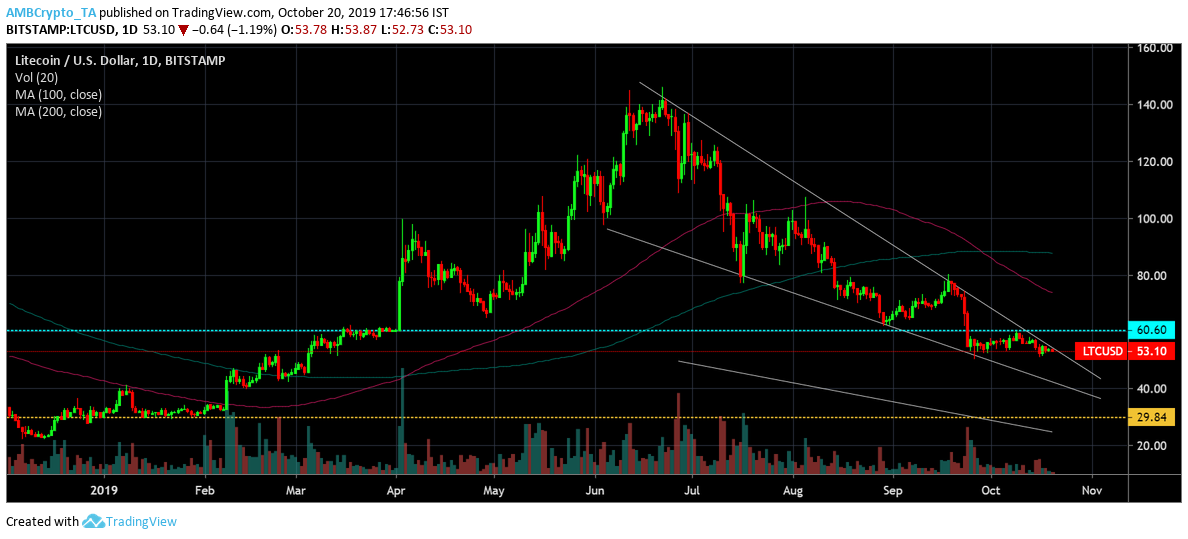
Source: LTC/USD on TradingView
The cryptocurrency’s price action noted a silver lining with the falling wedge pattern taking shape stemming from the mid-year highs on the daily LTC chart. The decline in volume within the same time frame provided further validity to the pattern. A breakout to the upside would mean breaching a crucial resistance at $55-mark.
Moving averages, however, aligned with the bears. 200 moving average was above 100 moving average following a bearish crossover by the two moving averages on 28th September.
A potential rise in LTC’s value could lead the coin to breakout and test resistance at $60.6 and a subsequent breach, thereafter, could lead the coin all the way up to $74-mark, where 100 moving average acted as a resistance point for the coin. The support stood firm at $29.84, a level unseen since January 2019.
Litecoin Daily Chart

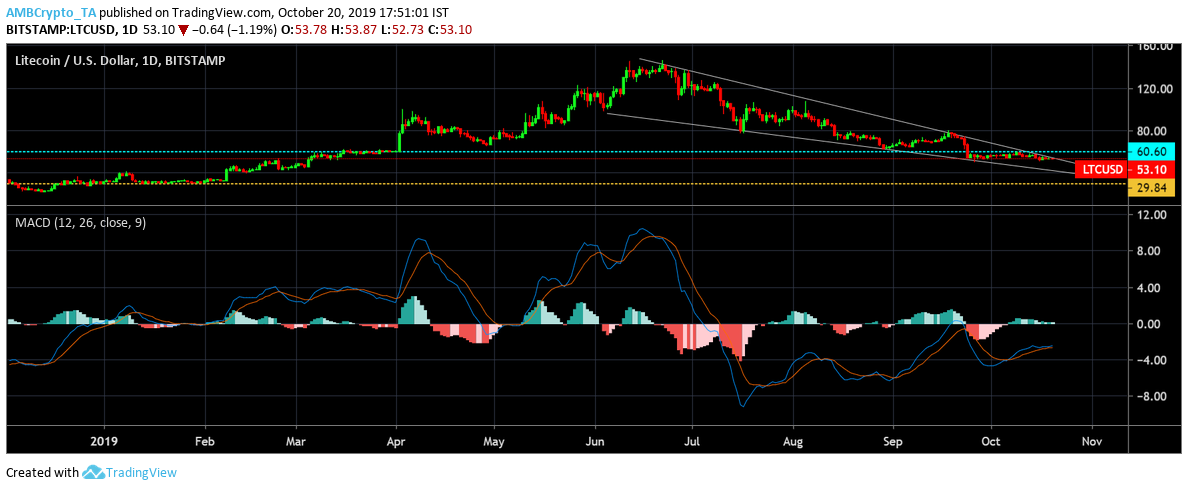
Source: LTC/USD on TradingView
MACD line was above signal line in the daily LTC chart, this was indicative of the coin potentially heading toward a much-awaited bullish phase in the near-term.
Litecoin’s price action has been really weak since its halving. And a bullish swing as predicted by the chart could lead the silver crypto to breach crucial levels.