Litecoin’s breach of ascending triangle may see the price shoot up

Litecoin suffered a loss of 16.21% in the month of September, resulting in the coin devaluing to $56.41 from $67.32. However, the coin has been reporting strong performance in the month of October, noting a growth of 3.53%, and placing its value at press time at $57.35.
It would also seem that the price of the sixth-largest coin may find some respite in the long-term.
6-hour

Source: LTC/USD on TradingView
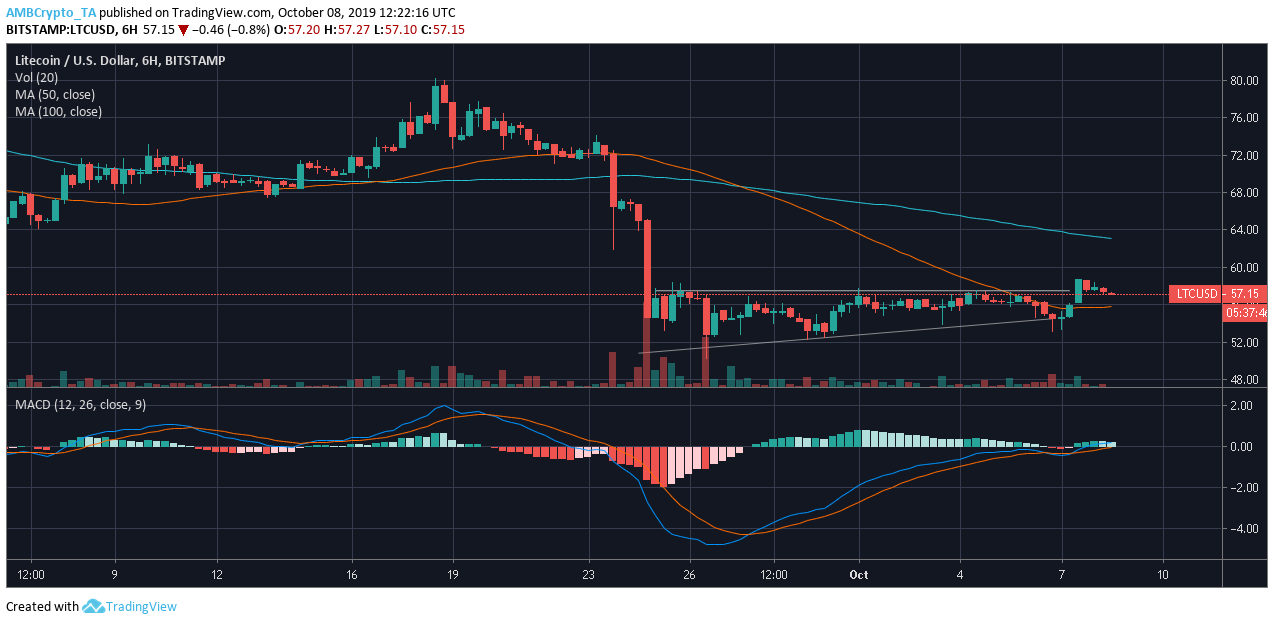
The 6-hour chart for LTC predicted the price to break out of the ascending triangle pattern. The triangle was being formed, marking the higher lows at $52.29, $53.68, $54.53, and resistance was drawn at $57.50. As per the nature of the pattern, a breakout towards the bullish side, taking the price of the coin to $57.50 may be seen.
The 50 moving average was resting under the 100 moving average, noting a weak bearish presence. The MACD line rested above the signal line, marking a bullish market.
12-hour

Source: LTC/USD on TradingView
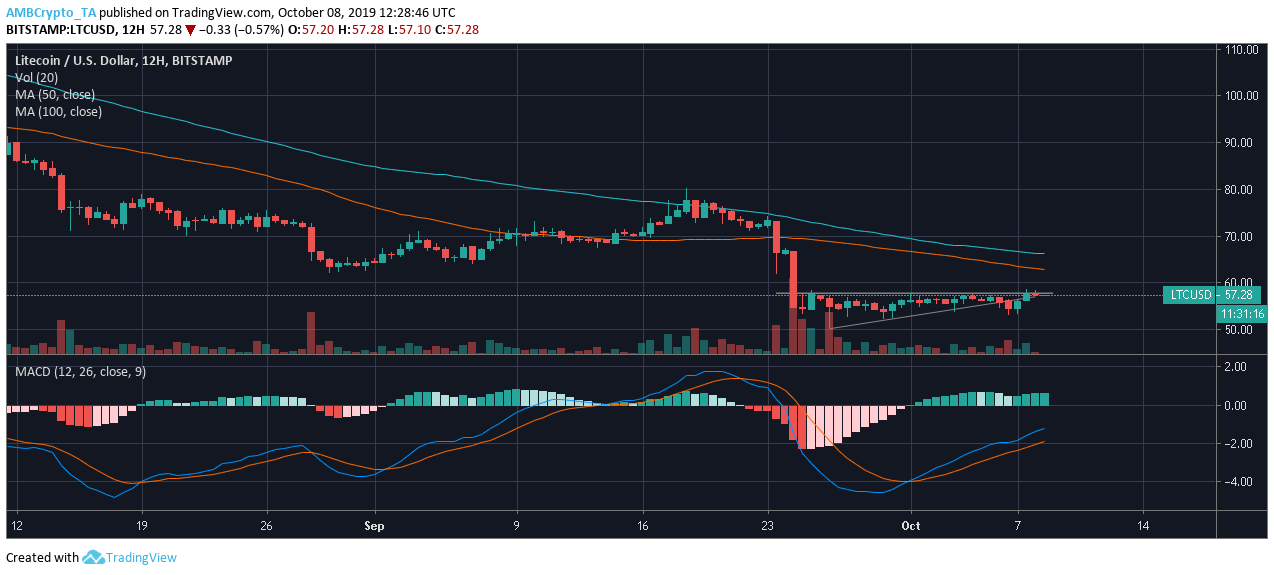
The coin’s 12-hour chart noted the formation of an ascending triangle. The price of the coin was consolidating between two trend lines; one of which marked the lower highs at $50.20, $52.43, and $57.03, while the resistance was marked at $57.80. The bullish nature of the pattern may shoot-up the price of the coin on the breach.
The 50 moving average lay under the 100 moving average, indicating bearish momentum in the market. However, the MACD indicator noted strong bullish momentum in the market.
Conclusion
The bearish market may be blown away by a strong bullish current in the LTC market.


