Analysis
Litecoin, Zcash, Synthetix Price Analysis: 06 October
Litecoin has been trending upward for a couple of weeks, but the asset would need a few more trading sessions to show if it could continue the trend or if there was an imminent reversal. Zcash showed bullishness and buyers were dominant in the market. Synthetix was bearish after the failure to defend a level of support.
Litecoin [LTC]
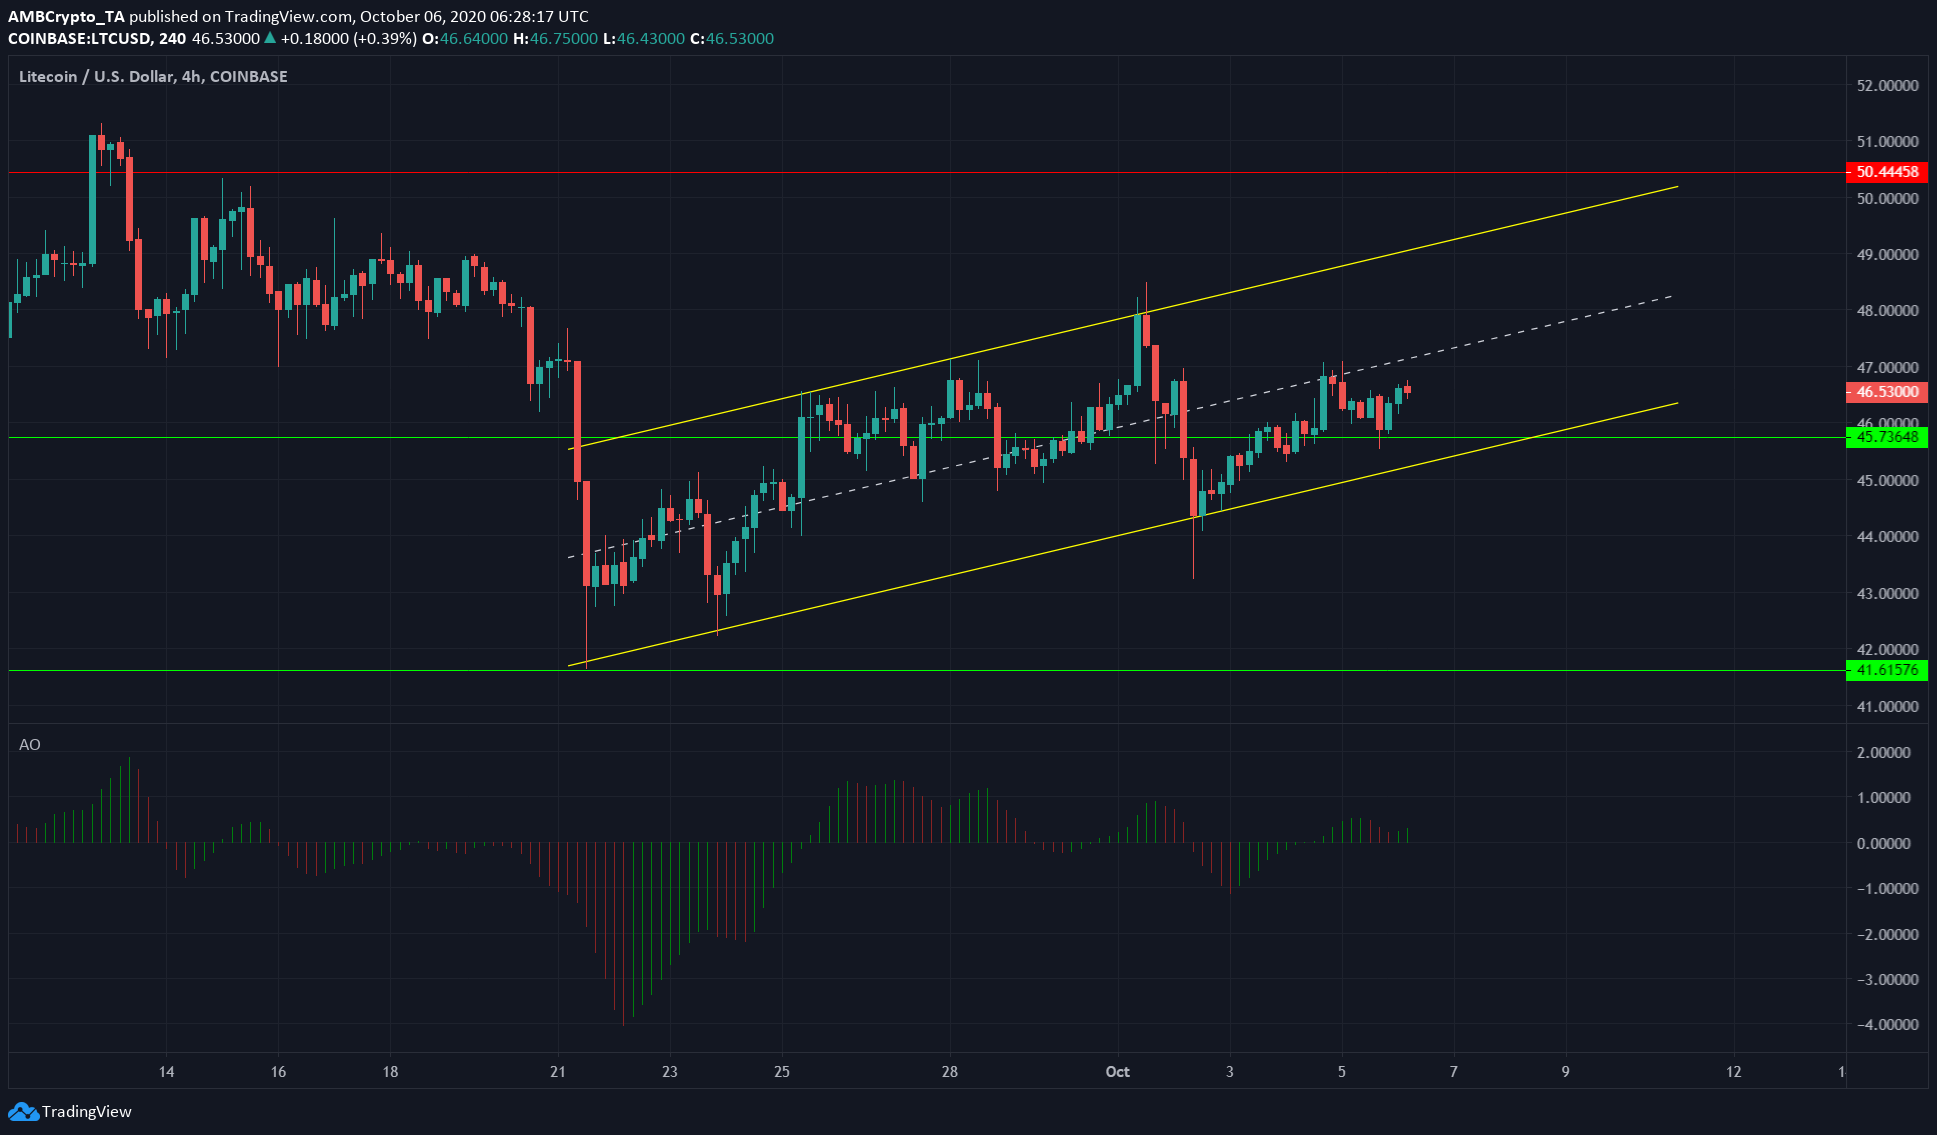
Source: LTC/USD on TradingView
Litecoin was moving within an ascending channel. However, it moved beneath the midpoint of the channel, and it was possible that the price would drop beneath the channel in the coming days.
Awesome Oscillator registered faintly bullish sentiment that threatened to crossover into bearish territory.
A move above the mid-point in the next few trading sessions would indicate that Litecoin was likely to test resistance at $50. If the price continued to remain near support at $45, it risked closing a trading session outside the channel and could be set to lose the level of support as well.
Zcash [ZEC]
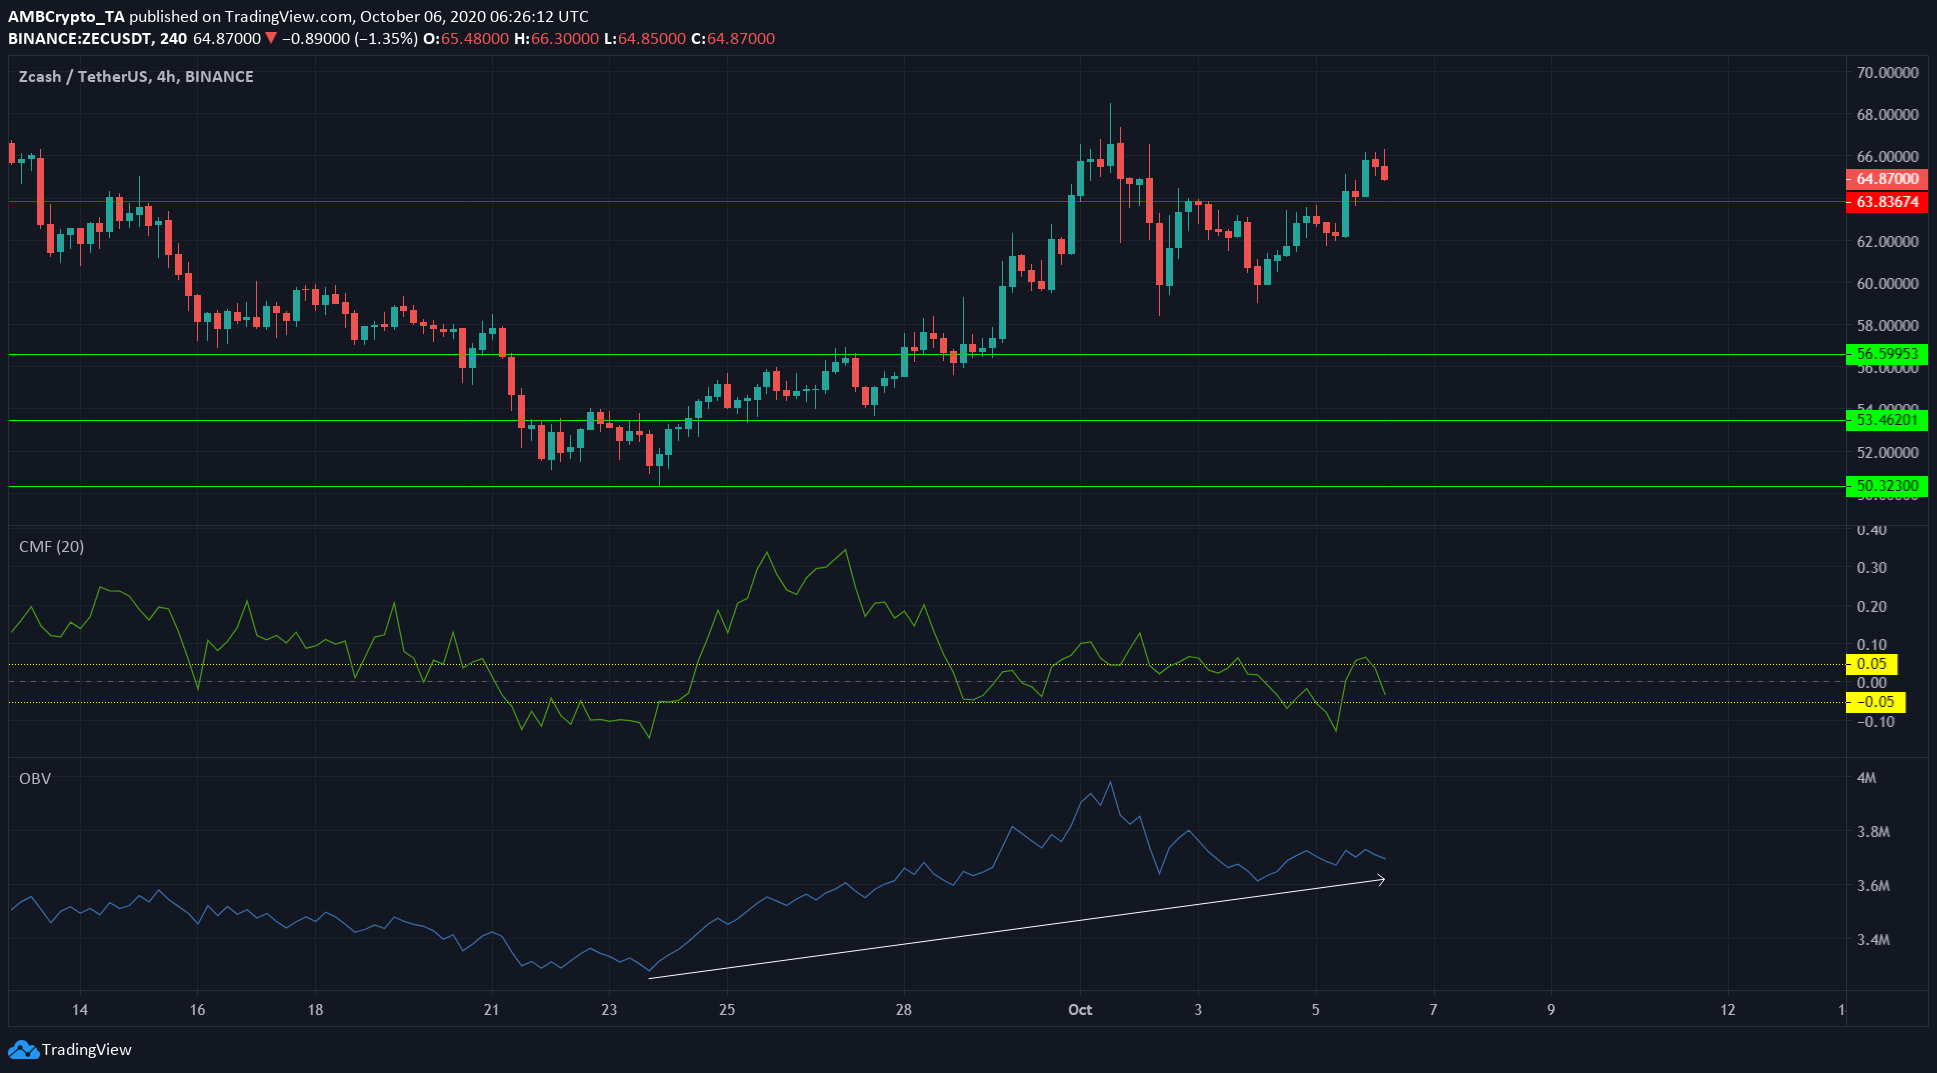
Source: ZEC/USDT on TradingView
Zcash was steadily trending upward. It rose past resistance at $63.8 but was rejected shortly thereafter. At press time, ZEC was once more trading above that level, and a retest is possible before the price continued its ascent.
OBV showed that buying volume far outweighed the selling volume. Even in mid-September, when the price dropped from $66 to $50, the OBV did not show a major wave of selling volume. This had hinted that the recovery might be quick.
The recovery began in late September and appeared to be going strong at the time of writing as well. CMF has been above or at the neutral zone, indicating equilibrium or capital inflow into the market.
In related news, Europol’s IOCTA published a report on cybercrime and decentralized marketplaces and highlighted Monero and Zcash as established privacy coins.
Synthetix [SNX]
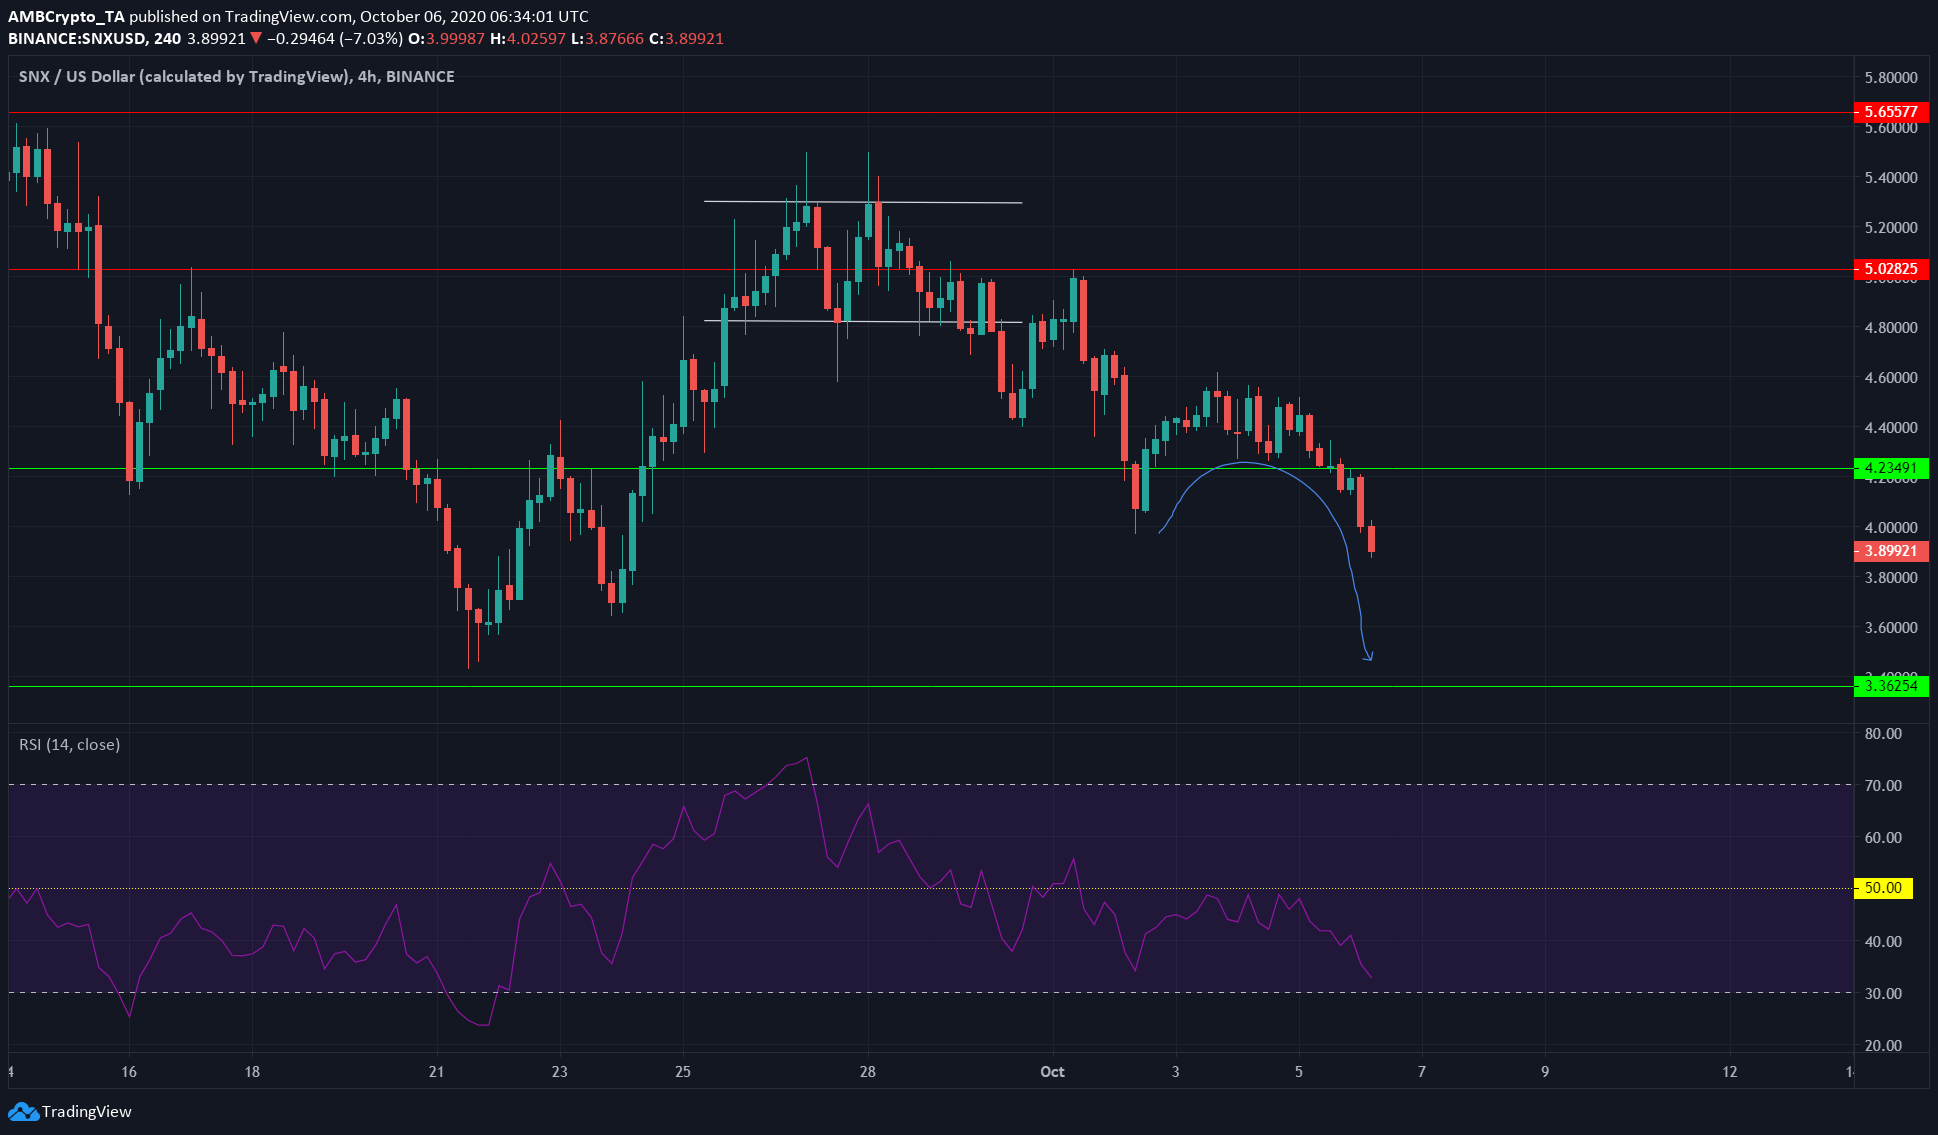
Source: SNX/USD on TradingView
SNX formed a double top at $5.2 a couple of weeks ago and has been registering lower highs since.
SNX was in the process of forming an inverted and descending scallop. This is a bearish pattern that would project a drop in price corresponding to the height of the scallop.
The RSI also showed the bearish momentum on the asset. RSI was at 33 and has failed to rise above the neutral 50 region in the past few days.
It would take a few more trading sessions for the pattern to complete if it does at all. However, in the short-term, the direction for SNX is downward. SNX can expect to find some support in the $3.65 region

![Reasons why Litecoin [LTC] investors should be concerned](https://eng.ambcrypto.com/wp-content/uploads/2023/12/ambcrypto_A_Litecoin-themed_scen-400x240.png)