Litecoin, Tron, Zcash Price Analysis: 30 October

Litecoin witnessed a drop in its buying volumes amid the market-wide sell-off, with the digital asset plunging below key support turned resistance levels.
Tron experienced some strong selling pressure, in the midst of a highly volatile scenario.
Finally, the technical indicators for Zcash too suggested a clear bearish outlook for its immediate short-term trading sessions.
Litecoin [LTC]

Source: LTC/USD on TradingView
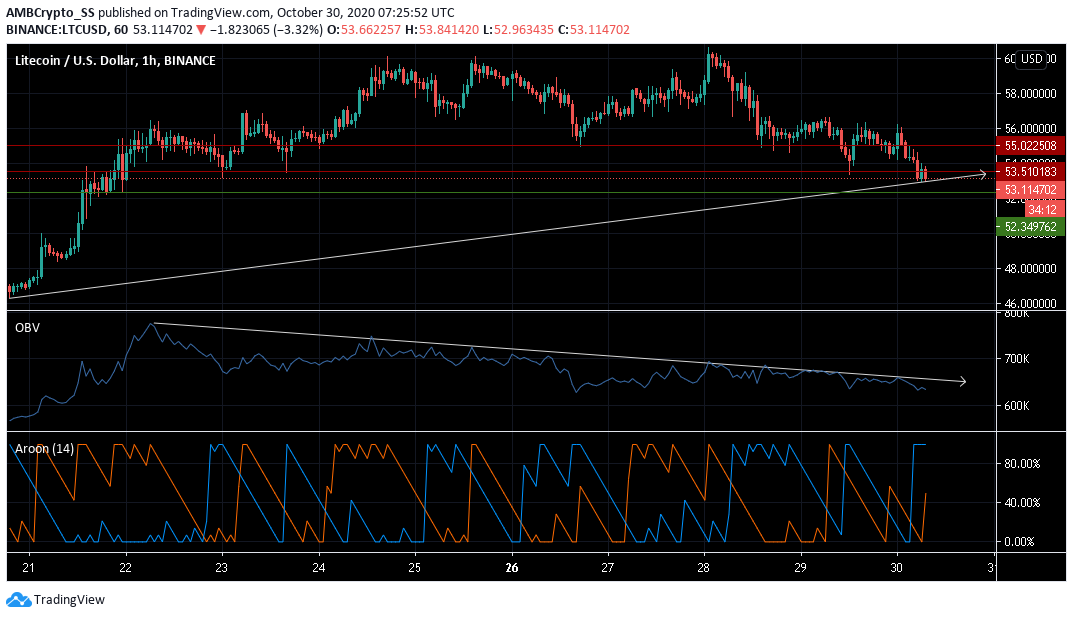
At press time, Litecoin was trading just above its trendline and close to the $53.51 support turned resistance level. The digital asset had displayed a consistent uptrend over the last week, however amid the market-wide sell-off, it recorded a 4% loss since yesterday.
The dip witnessed in the buying volumes as seen from the falling OBV levels also suggested, buyers lacked the required strength to stall the downward price action.
Aroon Indicator too, gave a sell signal, with the Aroon Down (blue) seen rising above the Aroon Up (orange).
However, as the bearishness subsides, prices might bounce back up from the immediate support at $52.349, over the next few trading sessions.
Tron [TRX]

Source: TRX/USD on TradingView
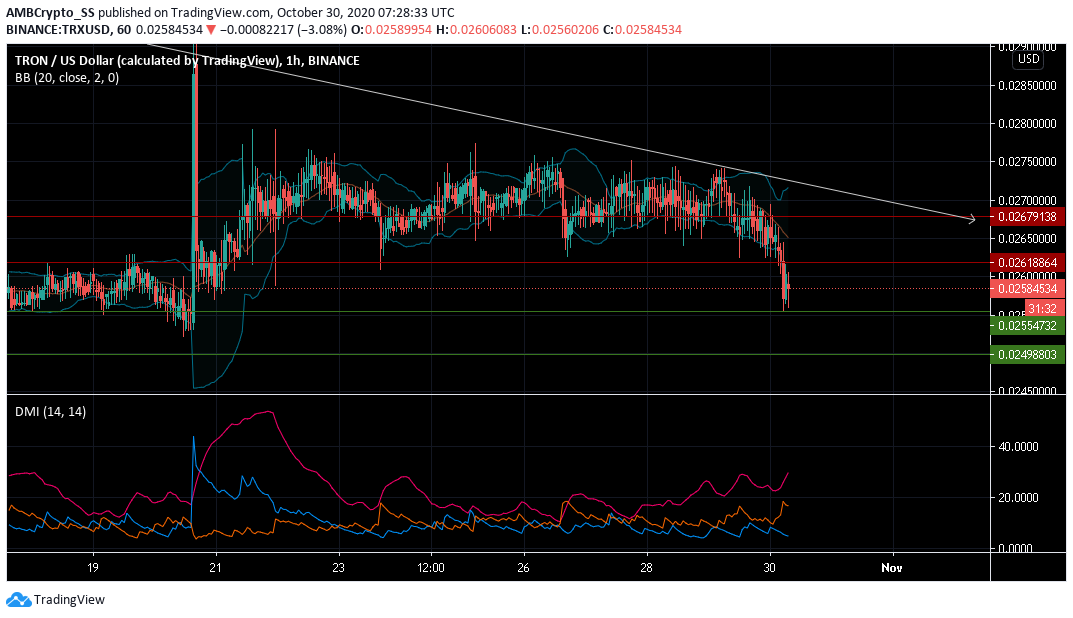
Going into the weekend, Tron was maintaining its overall downtrend. The digital asset at press time was trading well below its trendline indicating a strong selling pressure for the short-term period.
The Directional Movement Index, with its -DMI (orange) above the +DMI (blue) gave a sell signal. Further, a rising ADX (pink), meant the selling pressure was gaining strength.
Taking advantage of the situation, if sellers gather momentum in the region along the immediate support level, another wave of selling pressure could be expected during the weekend.
The increased levels of volatility, as picked up from the widening of the Bollinger bands also gave room to wide price action, that given the existing scenario, could favor the bears.
Zcash [ZEC]

Source: ZEC/USD on TradingView
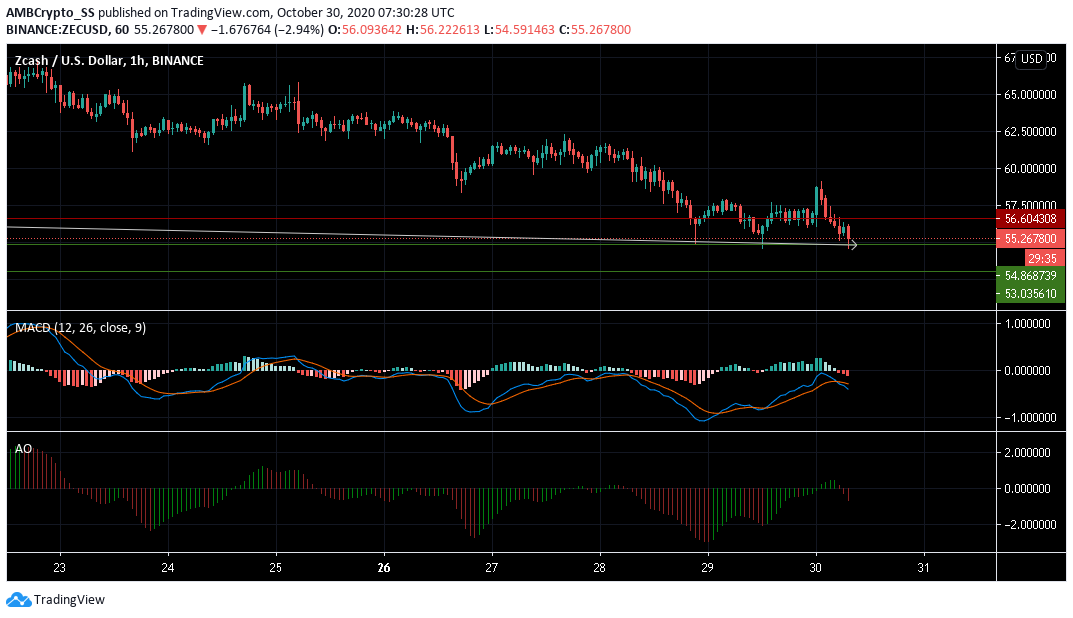
Zcash at press time was trading just above the trendline at the $55.26 level after falling from the $62.5 level over the last 48 hours.
Recording almost 2% in losses since yesterday, the digital asset’s technical indicators also remained bearish, MACD making a bearish crossover. Both the MACD and signal lines were seen below the zero level at press time.
The Awesome oscillator too was seen making a bearish crossover below the zero line, a clear indication of mounting selling pressure.
Price-wise, Zcash may experience short-term selling pressure, over the next few trading sessions.


![Reasons why Litecoin [LTC] investors should be concerned](https://engamb.b-cdn.net/wp-content/uploads/2023/12/ambcrypto_A_Litecoin-themed_scen-400x240.png.webp)


