Litecoin’s bullish divergence could facilitate 9% rise this week

Litecoin has recorded some much-needed upward price-action this year. After a staggering 40% drop over the last two months of 2019, LTC appreciated by nearly 76% year-to-date in 2020. According to CoinMarketCap, Litecoin had a market capitalization of over $4.58 billion, with $5 billion worth of Litecoin traded over the last 24 hours, at press time.
Litecoin 1-hour chart

Source: LTC/USD on TradingView
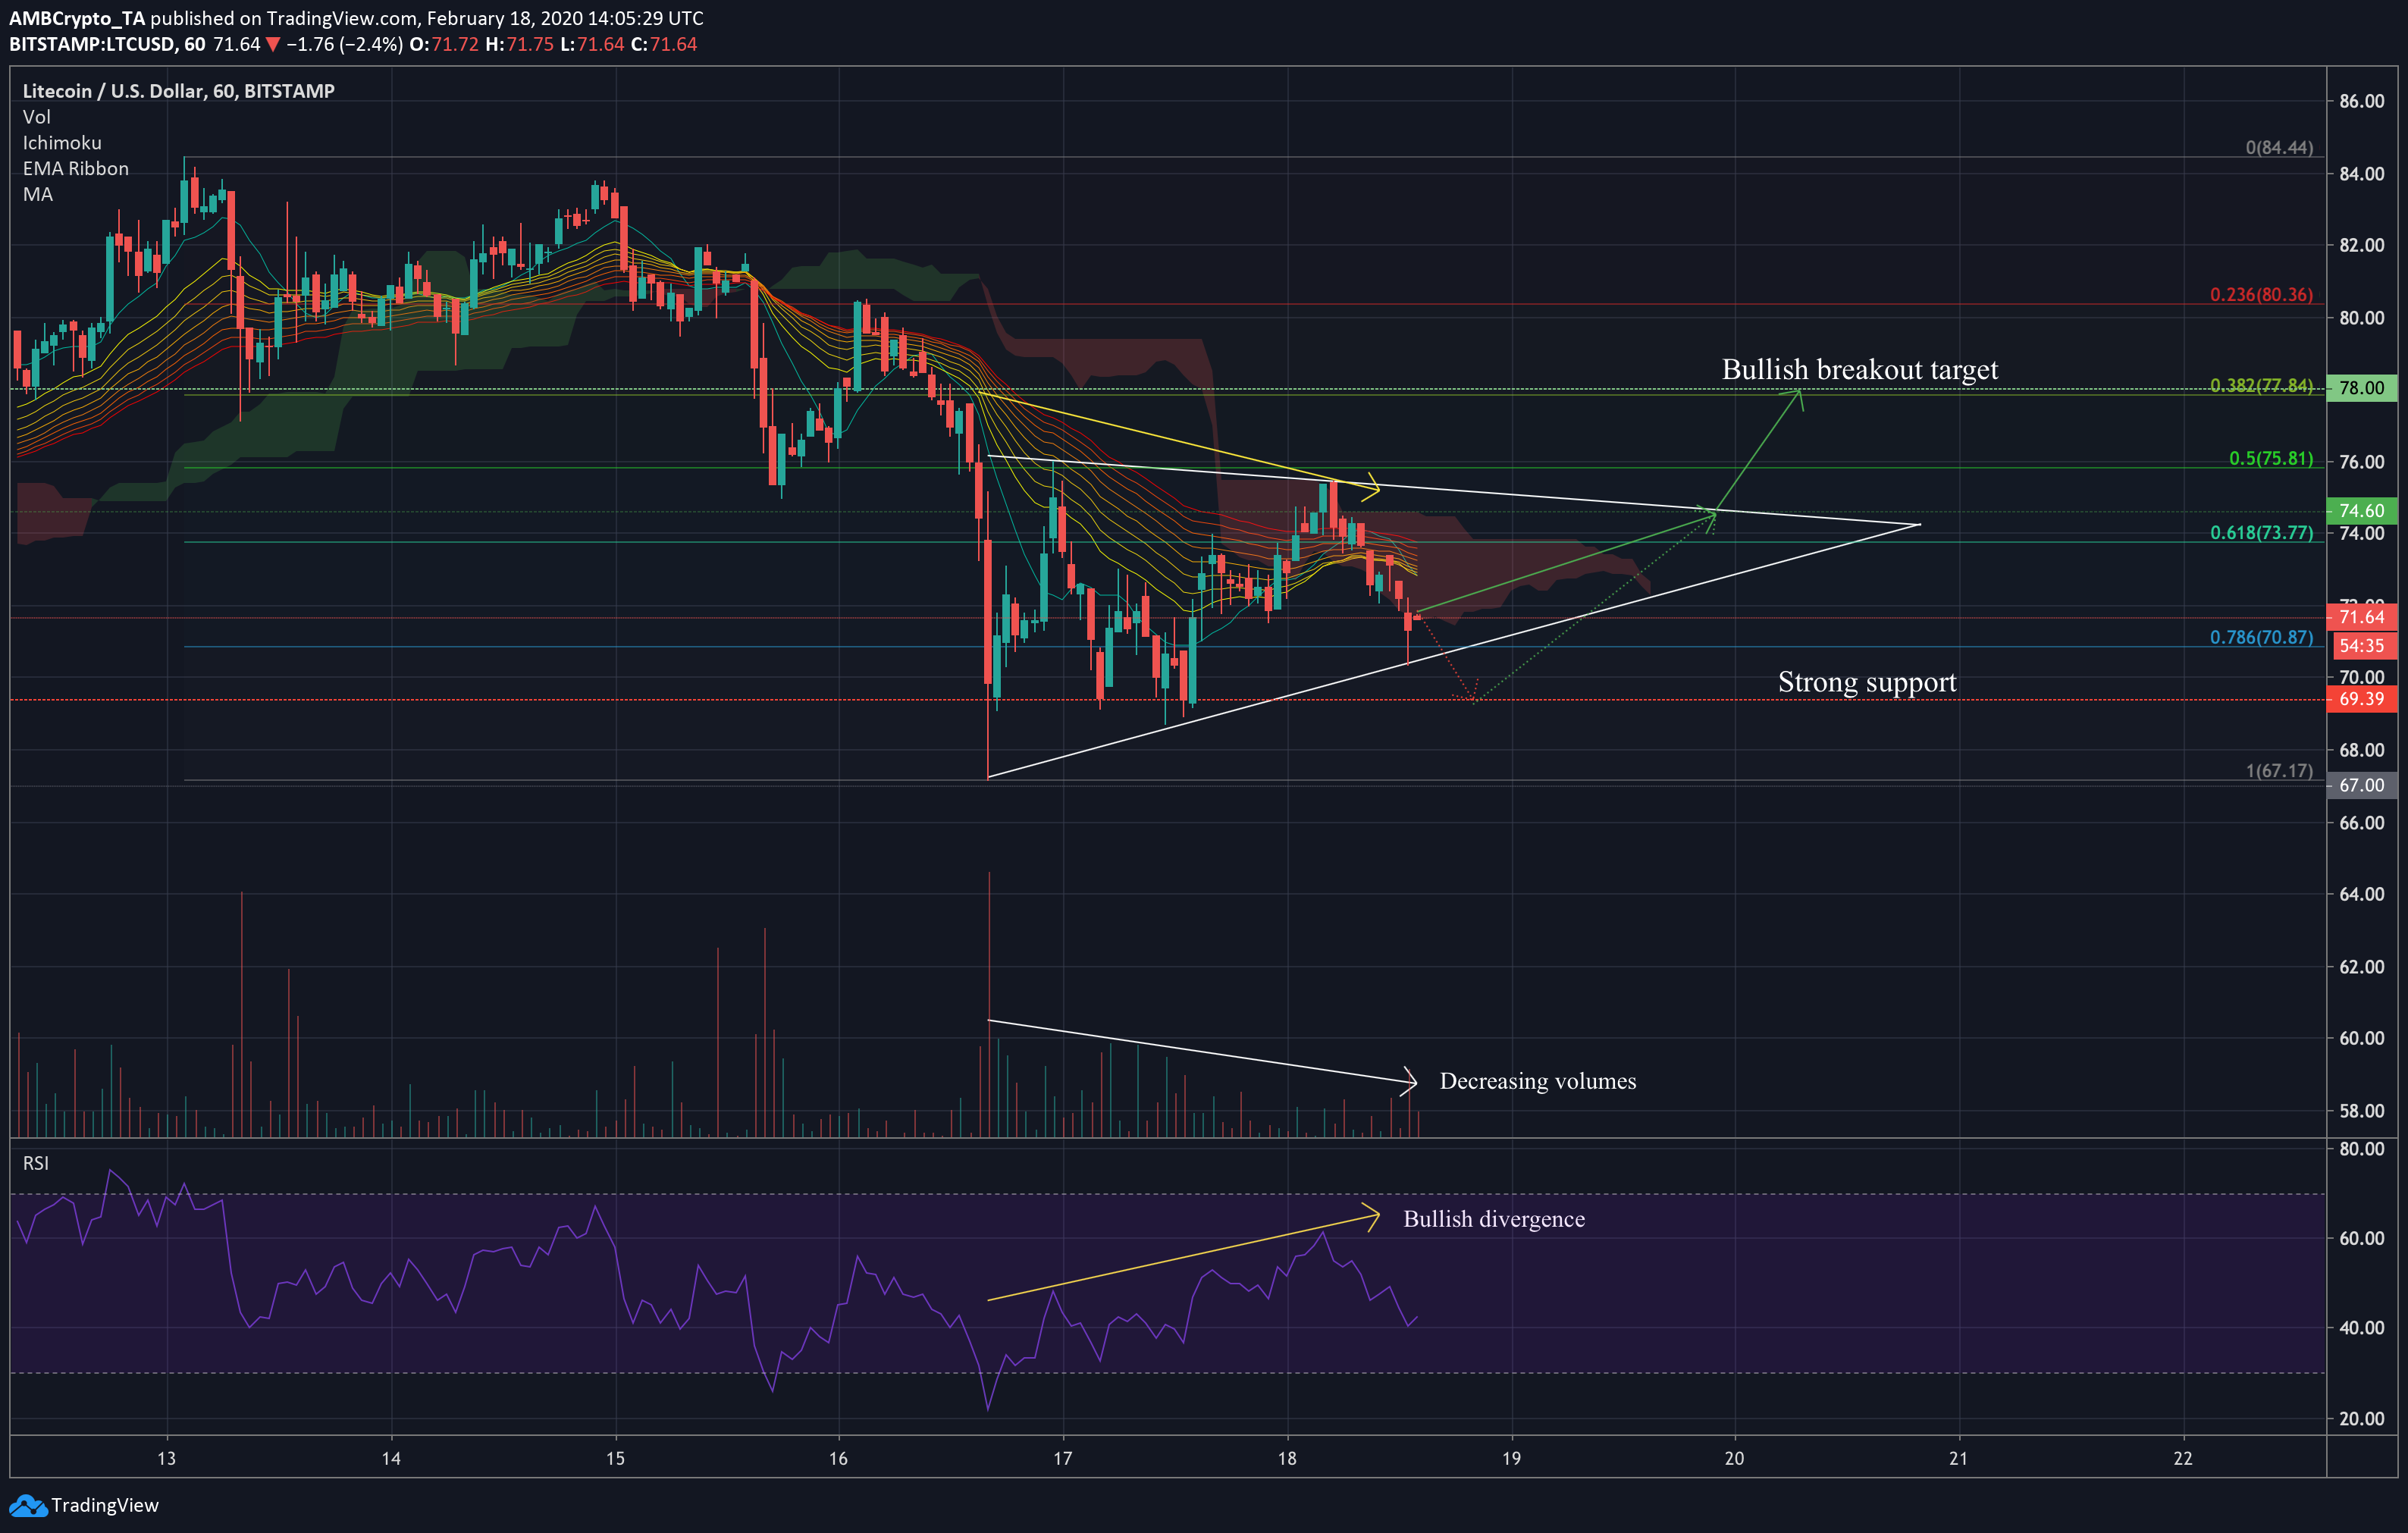
Litecoin appeared to have dropped into a symmetrical triangle formation over the last few days. These patterns are mostly bullish, indicating that an upward breakout might be on its way. The accompanying decreasing volume trend further confirms the pattern.
However, the EMA ribbons were seen moving above the price candles, something that is usually a sign of downward movement to come. Considering the fact that the latest candle on the chart was at the lower pattern boundary, this could be some cause for concern.
The Ichimoku Clouds also indicated some downward movement over the next couple of days. However, since the price was within the last cloud, consolidation seemed more likely.
While the last two indicators predicted downward or sideways movement, the Relative Strength Index (RSI) presented a case for bullish divergence. This happens when the price touches a new low as the RSI fails to do so. Bullish divergence is usually a sign of greener pastures and it could push Litecoin to the breakout point at $74.60 over the next few days.
Nevertheless, if Litecoin does break under the symmetrical triangle, a move under the $69 level seems highly unlikely as the price will probably find strong support there. This could form a busted symmetrical triangle, leading to a move back into the pattern, followed by a bullish breakout.
A move above the upper pattern boundary could push Litecoin to the $78 level, at the 38.2% Fibonacci retracement line, over the next few days.
Correlation with Bitcoin

Source: CoinMetrics
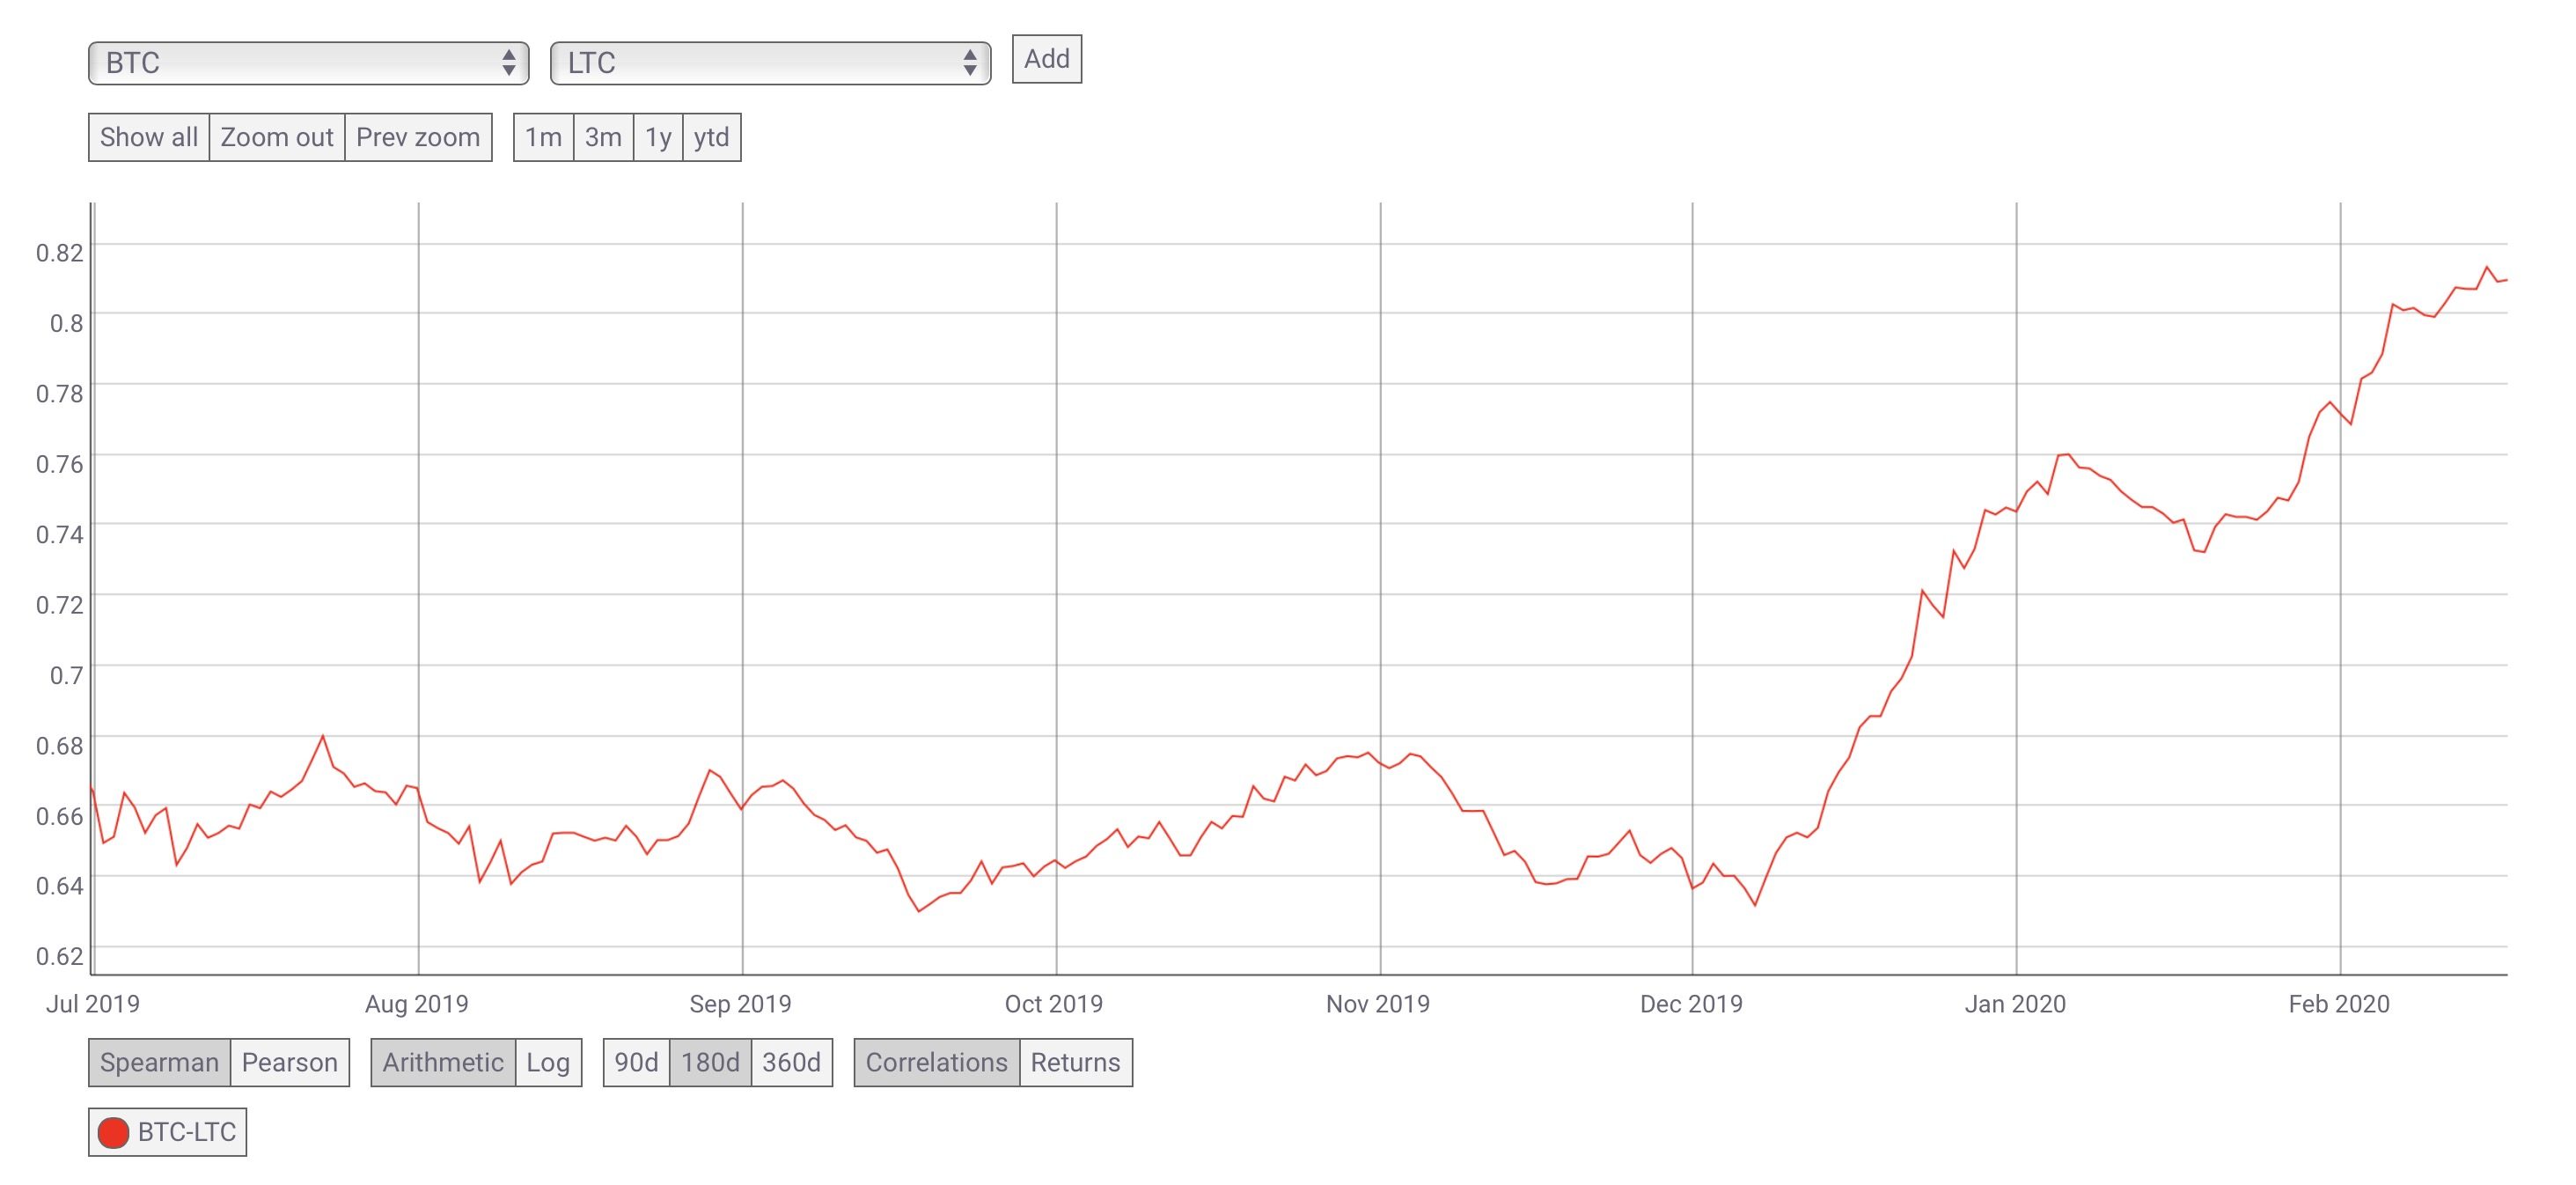
CoinMetrics’ data on Litecoin’s 180-day correlation with Bitcoin shows LTC’s relatively stable correlation with BTC through the second half of 2019. However, it looks to have been rising since mid-December and it is currently at its highest level since April last year. With Bitcoin projected to move up in the short-term, Litecoin might seem some of that action too.
Conclusion
Despite bearish indications from EMA Ribbons and Ichimoku Clouds, the bullish divergence from RSI and the overall trend of upward breakouts for this pattern likely mean that Litecoin will appreciate in the short-term. LTC will probably move up to the $74.60 level, before breaking out to the $78 level over the next few days. Though there is potential for a downward-facing breakout, it is unlikely that Litecoin will move under the $69 level before returning to its bullish path.


