
The Bitcoin Fear and Greed Index is hinting at extreme Greed as it inches closer to the 2017 level of 95. Currently, the index is at 94. A look at the price chart makes it evident that many retail traders may be making trading decisions based on the Bitcoin Fear and Greed Index. However, the F&G hasn’t given the best signals in the past July and September 2020.
In the first look, it seems that the Fear and Greed Index serves a good first look at the market and direction of price trend, it offers info on possible trend reversal to watch out for. However, in a highly vulnerable market, the Fear and Greed Index may be just like other on-chain analyst metrics and need further support from fundamentals and the price chart, and market capitalization. There have been times when the Fear and Greed Index has hit tops for weeks and the price has continued upward trajectory unopposed. This is counterintuitive to the signal from the Fear and Greed Index. In July 2020, the Fear and Greed Index was at 76, it hit 84 in August and September, dropped mid-September during a price correction. It is now back at 94, closer to the December 2017 and early 2018 level of 95.
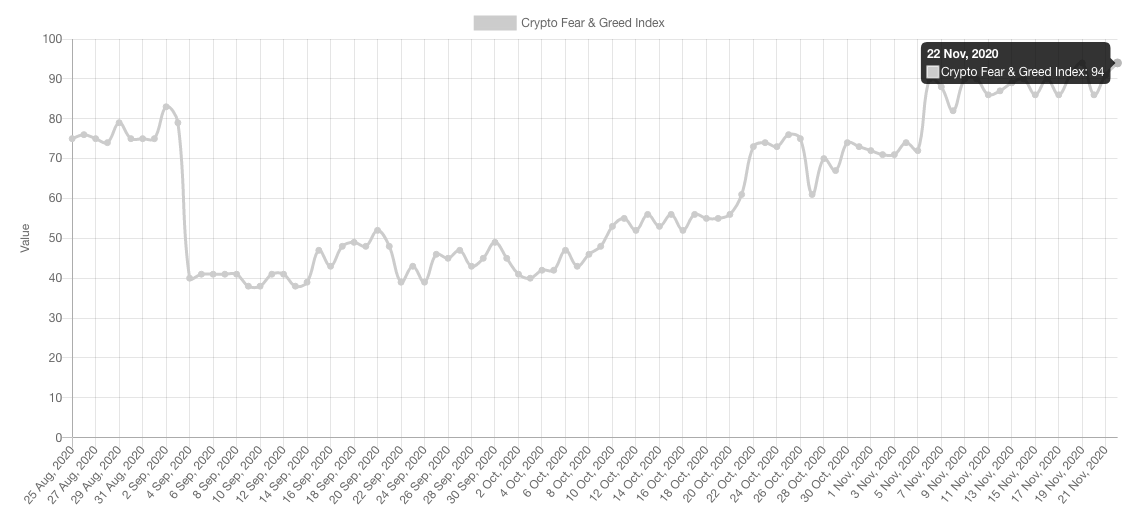
Bitcoin Fear and Greed Index || Source: alternative.me
During the 2017 Bullrun, though the Fear and Greed index signaled a rise in Greed and indicated extreme greed, the price trajectory moved up unopposed until the drop above $19000. Akin to the 2017 Bullrun, the Fear and Greed index in September 2020 hit a high and post a correction, in less than 2 months the price is up by 75% instead of a massive drop that was anticipated.
Despite this, many traders are still relying on the Fear and Greed index and that shows in the price chart on spot exchanges. In the past three days, Bitcoin’s price has oscillated from $18100 to $18800. Additionally, the Bitcoin Network Momentum chart doesn’t recognize the current price rise as a Bullrun, though it is high on momentum relative to 2018 and 2019. Traders have experienced the momentum and volatility firsthand, however, it is not being recognized in the metrics chart.
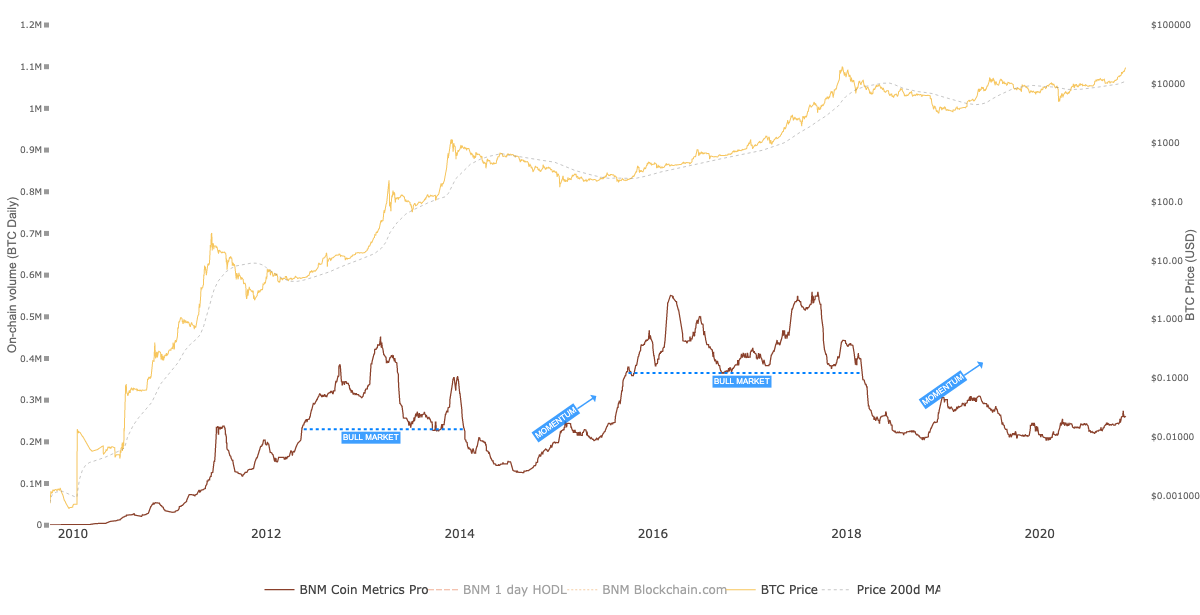
Bitcoin Network Momentum || Source: Woobull Charts
What’s interesting is that the momentum hasn’t matched the 2019 level and this indicates that the price may sustain above $18000 and hit a new ATH before this phase of the market cycle ends. There is more stability and predictability in the Bullrun with improved on-chain metrics and institutional OI and volume at peak. The volatility isn’t even close enough to the 2019 level, and this suggests traders are opening trades influenced by the fear of a drop in price, a correction to the fair price that stands at $8500. Fear aside, the index may possibly be an outdated way of predicting price movements in a futuristic and volatile market.