Comparison between Bitcoin and the U.S dollar is an unavoidable plot in the current financial industry. With the increased interest in the Bitcoin market, the asset is currently more defined and credible than in the past and its movement has often been the bud of many discussions.
With the U.S dollar index recently rising, an inverse correlation between Bitcoin and U.S dollar can be witnessed in the chart. However, this time, the M1 Money supply can be witnessed as well.
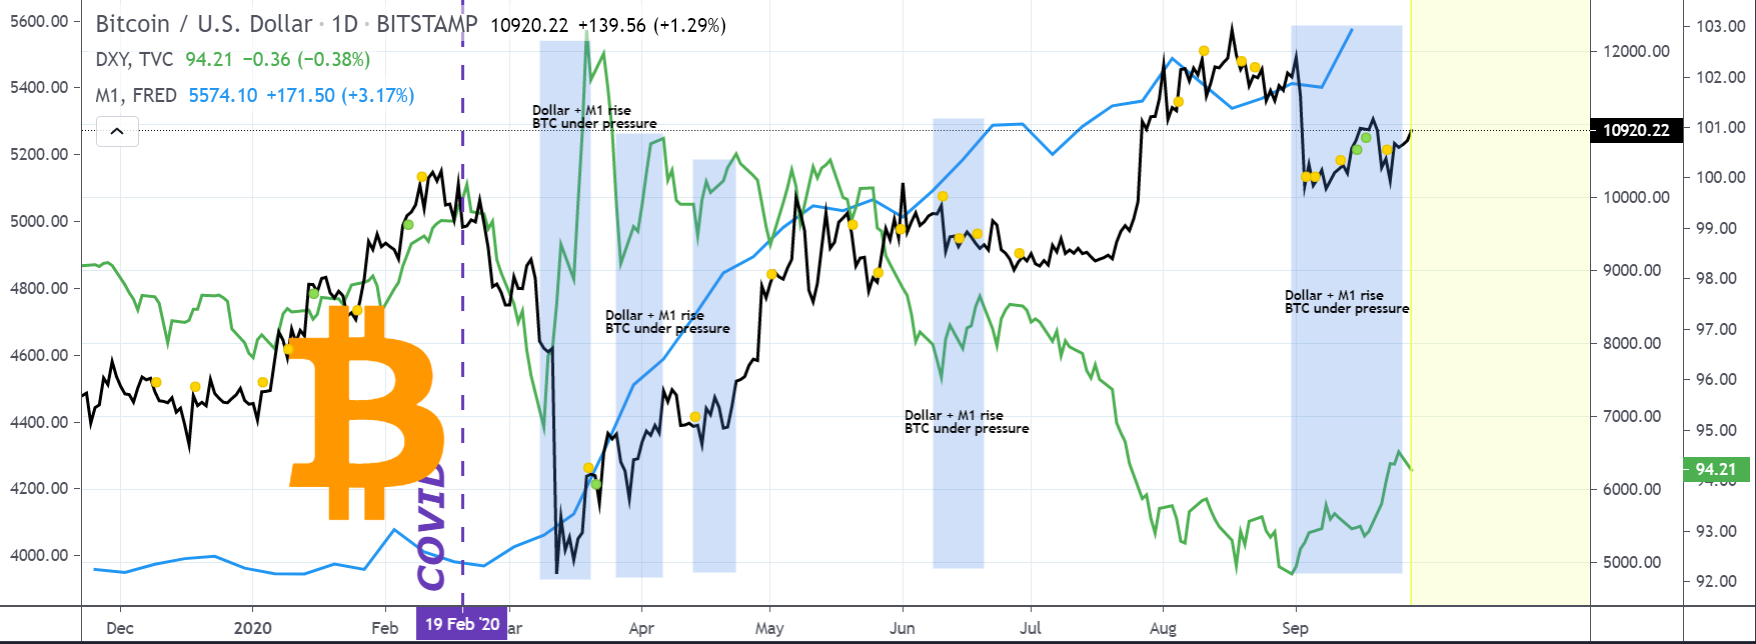
Source: Trading View
The chart above clearly explains that Bitcoin’s recent decline and the asset facing heavy sell pressure came towards the same time when the U.S dollar started to pick up its value in the market. On 1st September, the reversal can be observed as Bitcoin’s price failed to breach above $12,000 and the dollar value alongside M1, rallied above it.
With Bitcoin’s value appearing shackled at the moment, it might a temporary facade.
Federal Reserve might not be in control of the Money Supply Growth
The global economic landscape is still riding on an uncertain path as concerns over the second wave of COVID-19 is making the rounds. Amidst such turbulence, the U.S government is encouraging investors to put their money in the greenback. Meanwhile, talks over another fiscal stimulus are taking place, and supporting the dollar right now is possibly making it worse.
It is due to the fact that the Federal Reserve might not be in control of the Money Supply growth anymore. Mike Wilson from Morgan Stanley indicated last month,
“It’s fair to say we have never observed money supply growth as high as it is today.”
Now, this is particularly a problem because if the Feds are not in control of M1 growth, they would not be able to control inflation either; if inflation unfolds later in the year.
Now, the particular caveat between M1 and Bitcoin rides in the below chart.
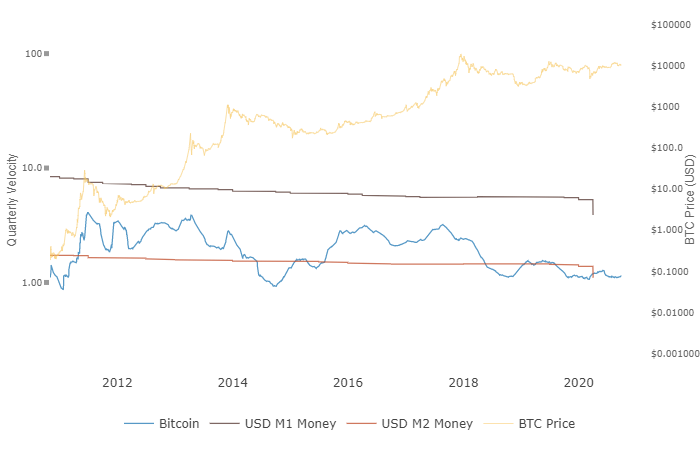
Source: woobull chart
While M1 dictates the growth of liquid cash and coins in circulation, M2 is the broad combination of liquid+non-liquid assets. Since M2 has a wide defined outlook, economists and investors tend to watch changes to the M2 supply as an indicator of the total money supply and future inflation.
It so only happens that Bitcoin had inclined towards M2 over time, which means the king coin adheres to the control on a broader list of assets rather than only cash.
Wilson had added,
“The risk of higher inflation may be greater than it’s ever been, too.”
Right now, another episode of fiscal stimulus does not guarantee any situation where the U.S dollar’s value is safe in the future. If it does not work in favor of the fiat in the coming months, the U.S dollar will decline in the charts again and a piece of the ‘capital-pie” will be grabbed by Bitcoin.
To be fair, Bitcoin’s short-term future is riding a lot with the U.S dollar at the moment. A year or two from now, the inverse-correlation might cease to exist but at the moment, with the current elections and changing socio-economic structure, the U.S dollar is becoming a needle mover for the larger financial industry.