Ethereum’s price recovery may be assisted by breach of falling wedge

Ethereum hasn’t recorded great price movement in 2019, with the altcoin‘s prices going over the $200 mark on several occasions. However, it has not been able to consolidate on these gains.
Ethereum was trading at $176.82 at press time, with a minimal gain of 0.97% on the 24 hour chart as per CoinMarketCap.
1-Day Price Chart

Source: ETH/USD on TradingView
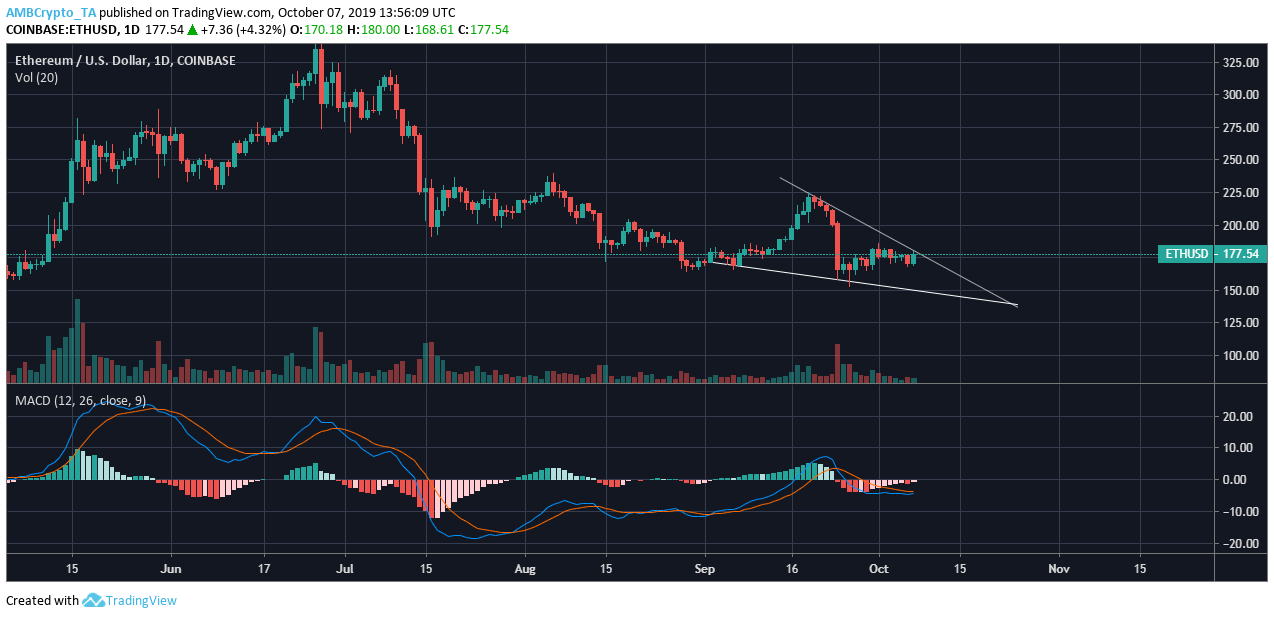
Ethereum formed a falling wedge pattern on the 1-day price chart, something which was characterized by two converging lines having its lower highs at $224, $215 and $180, while the lower lows formed at $169, $167 and $158. The formation of a falling wedge pattern is considered bullish as the price breakout is often upwards. So, Ethereum looked set for a bullish price movement in the long-term.
The MACD indicator suggested a bullish price movement as well, where the MACD line was set for a bullish crossover with the signal line. The bullish crossover might appear in the coming week as the market has started to see upward price movement, starting from today.

Source: ETH/USD on TradingView
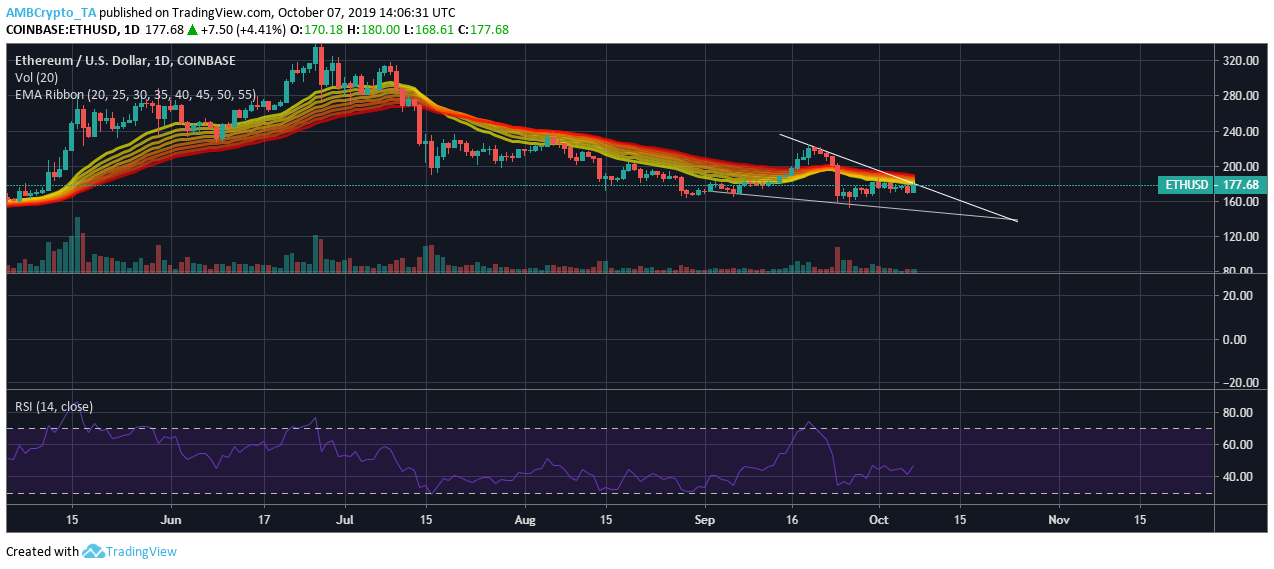
The price candles remained under the EMA ribbon, but were set for a breach above it after Ethereum manages to breach out of the falling wedge pattern. The RSI indicator looked bullish as it suggested buyers have started to gain the upper hand in the market.
Conclusion
Ethereum looks set for a bullish breakout if it manages to break out of the descending wedge pattern. The MACD indicator also hinted at possible bullish price action as it was set for a bullish crossover with the signal line. The RSI indicator showed that buyers had an upper hand.


