Ethereum’s price on shaky ground as altcoin set to breach descending triangle

Ethereum, the second-largest cryptocurrency by market cap, has been struggling to see a significant uptick in its price ever since the death cross on 4 September. The altcoin’s price did register a good bullish price rally between 12 September and 19 September. Since then however, the price has been moving sideways with a few upticks in between.
At press time, Ethereum was trading at $172.62 with a fall of 2.74% on the 24-hour chart. The altcoin had a total circulating supply of over $18 billion, according to Coinmarketcap.
1-Day Price Chart

Source: ETH/USD on Tradingview
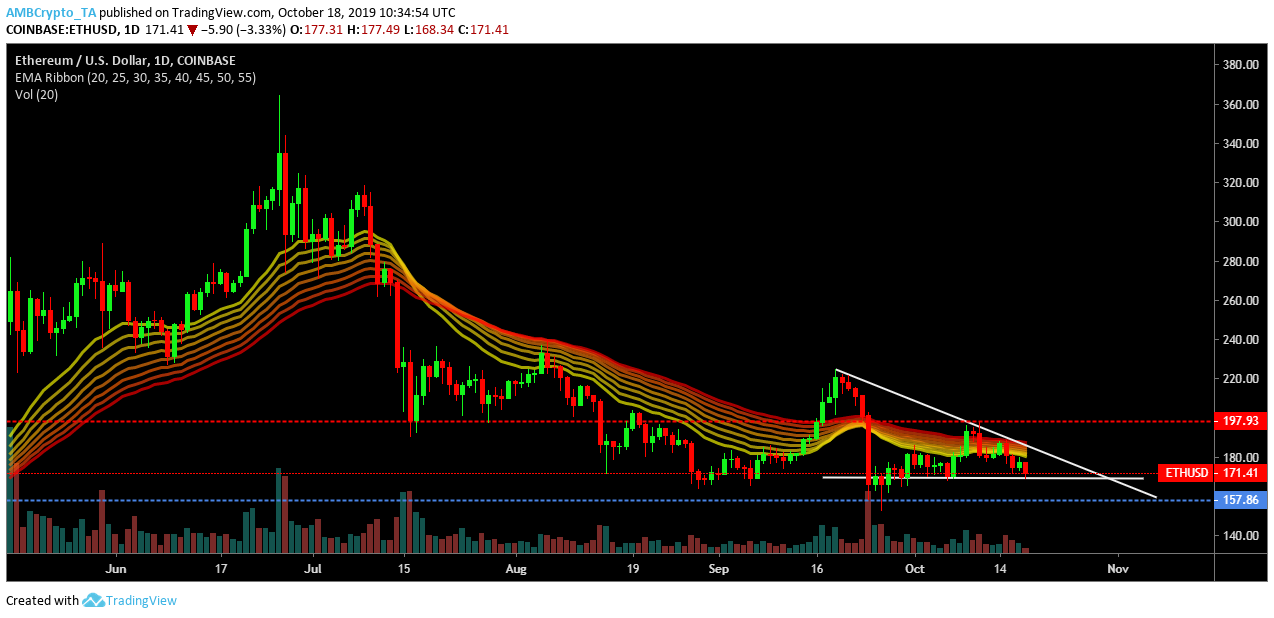
On the 1-day price chart, Ethereum formed a descending triangle pattern, characterized by lower highs meeting the descending triangle at $225.78, $218.31 and $193.78. The descending triangle had a constant baseline of $170.82. The formation of a descending triangle pattern is considered bearish as a breach from the pattern is often downwards.
The EMA ribbon was acting as resistance as the prices were under the ribbon, which suggested that the bearish sentiment was prevalent. The EMA ribbon also suggested that although price volatility was considerably low, it was higher since 24 September.

Source: ETH/USD on Tradingview
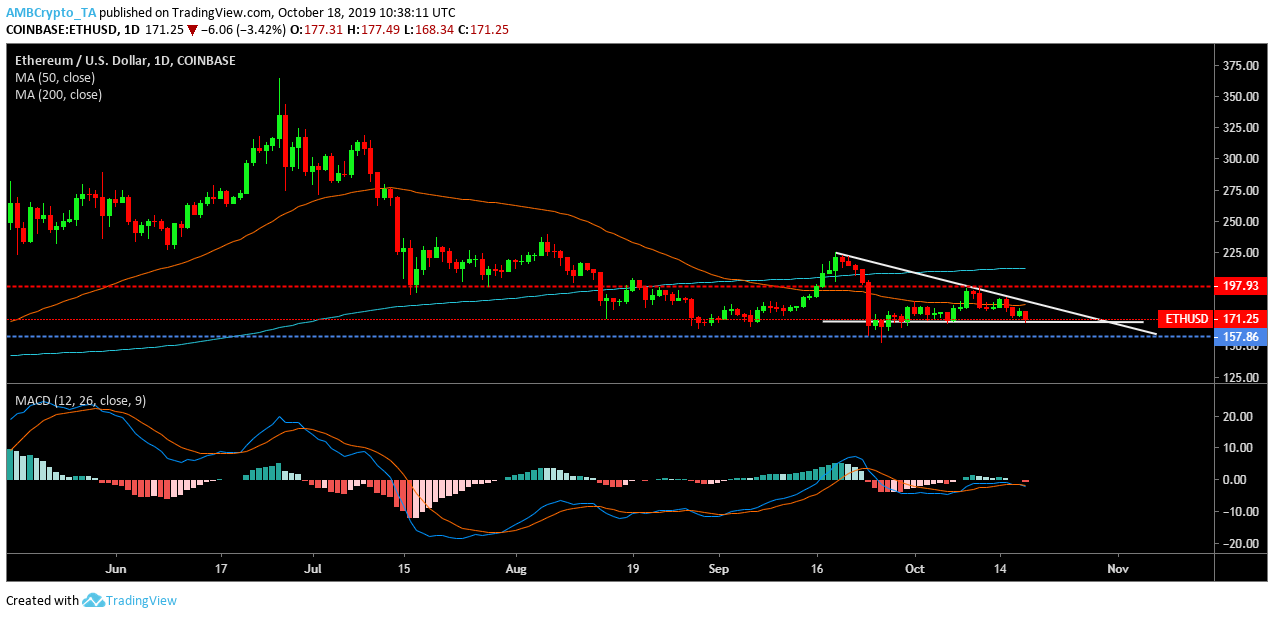
The 50-day moving average went under a death cross with the 200 moving average on 4 September and since then, the 200-moving average has been acting as resistance for the second-largest cryptocurrency. The MACD indicator had a bearish crossover with the signal line on 17 October and it has remained bearish since then. Thus, the overall market looked bearish.
Conclusion
Ethereum’s price might slump even further as key indicators and descending channel pattern formation suggest that the market sentiment was bearish at the moment. Ethereum also went under a death cross, only the second in its lifetime, on 4 September and since then, the bears have been dominant in the market.


