
There is a lot happening within the Ethereum ecosystem. Although Ether’s value has struggled to break above $400, at the moment, the network is witnessing astonishing levels of activity. However, the balance in the Ethereum space did not seem completely right as while a few metrics flashed warning signs, others were noting new highs.
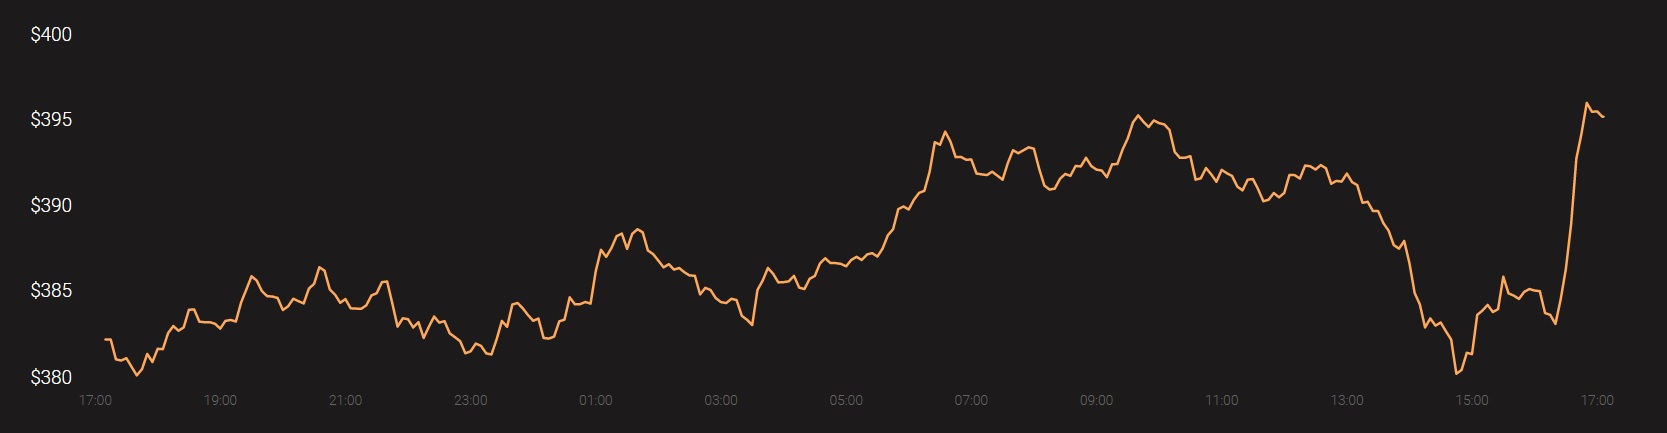
Source: Coinstats
One such disparity was recently highlighted by Santiment’s data.
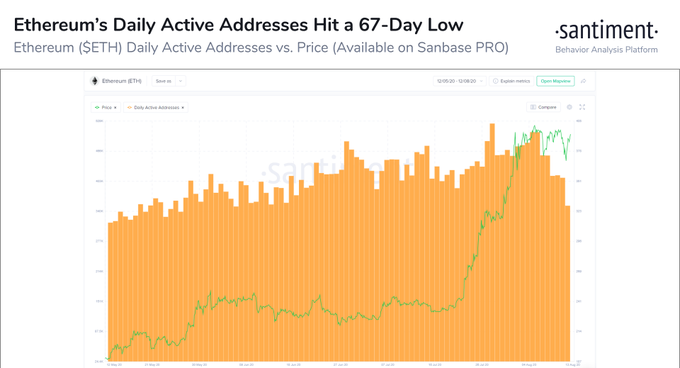
Source: Twitter
As illustrated in the attached chart, Ethereum’s price activity has taken the market by storm over the past few weeks and even though the crypto-asset is struggling somewhat, maintaining a high-level consolidation on the charts is a good sign for any digital currency.
Alas, in the meantime, its daily active addresses count touched a new 67-day low, clocking in at 351.3K on 12 August. The last time the network’s active addresses were so low was back on the 7th of June, a time when Ether was valued at under $240.
The aforementioned data definitely doesn’t sit well with respect to the ecosystem’s development activity and valuation, but this wasn’t the only contradiction, at the time of writing.
Ethereum Fees, Hashrate, Miner Revenues – High-fiving at highs?
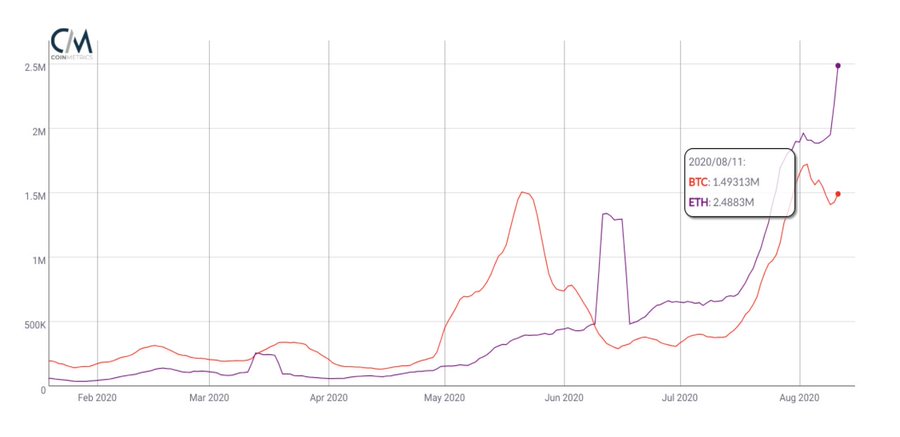
Source: Twitter
The attached chart drew the distinction between on-chain transaction fees for Bitcoin and Ethereum, at press time. There was a huge difference of $1 million in fees between them, owing to which, Ethereum was perhaps the most expensive network to use.
Alongside on-chain fees, the hashrate seemed to be noting new highs as well. According to data from Etherscan.io, ETH’s hashrate was at a 20-month high, clocking in at 201,000,000 GH/s, at press time, a figure last seen in 2018.
Now, the growth in hashrate and on-chain transaction fees logically means that users are swarming into the ecosystem and activity should be off-the-charts.

Source: Glassnode
In fact, the attached chart would back the notion that Ethereum miners are definitely accruing strong profits after reaching an all-time high of 18% on a 30-day average. However, as mentioned previously, the daily active addresses count seemed to tell a different tale.
So, why are Ethereum active addresses dropping?
Well, let’s address the grey elephant in the room. DeFi protocols are consuming the Ethereum space at an alarming rate and they are practically pricing out other addresses to get their transaction through.
Now, the problem is that high transaction fees, even though seen to be extremely positive from a long-term perspective, are literally decreasing the value of the network from a fundamental point of view.
It is a classic case of “too much of anything is not good,” and while DeFi protocols inflate gas prices, they are also relying on high levels of usage to generate fees and take profits from token holders. Hence, if transaction fees cross a certain threshold, then the utilization of Ethereum will not remain feasible for potential profits.
Right now, the Ethereum space is congested and nobody expected that two years back. However, if the long-term is a matter of concern, Ethereum could possibly be shooting itself in the foot as the development of the space might be heading in the wrong direction.