Altcoins
Ethereum’s near-term future seems bullish as Lisk, Ontology recuperate

Leading altcoins like Ethereum, XRP, and Monero, or any other top 50 altcoins for that matter, have all been facing a similar price movement over the past couple of days. 22 days since ‘Black Thursday,’ the after-effects are still being felt, with many altcoins signaling a highly volatile period in the near future.
Ethereum [ETH]

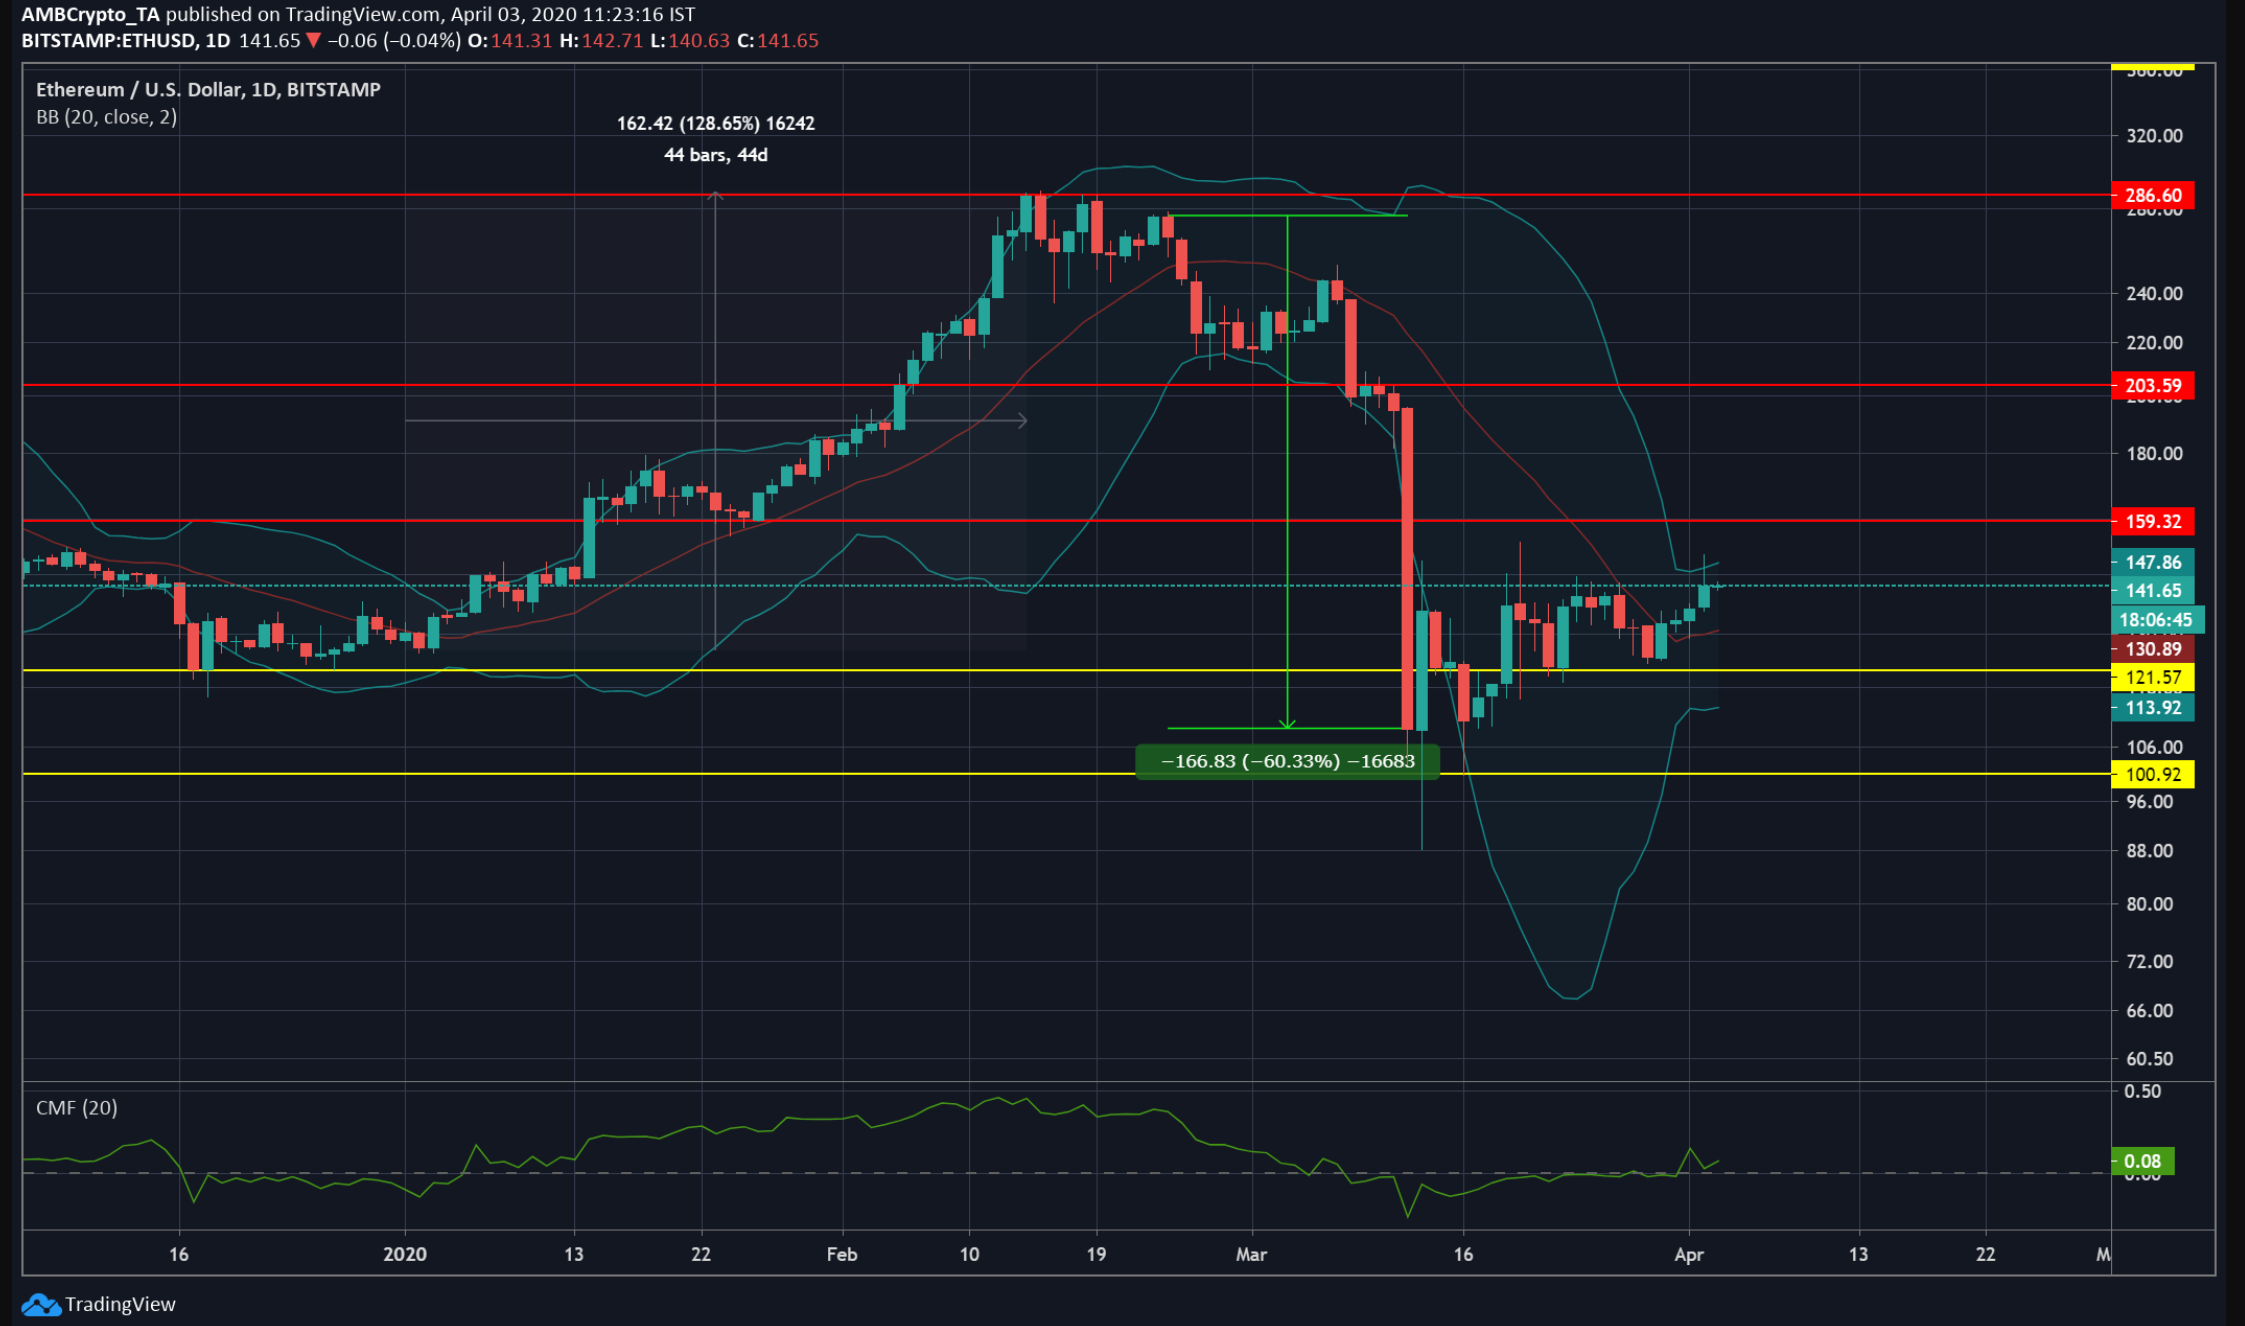
Source: ETH/USD, TradingView
The world’s top altcoin began the year 2020 with a lot of energy. The coin, trading at $126 on 1 January, rose by 128% in a month to reach $288.6. However, the coin started a downward run on 24 February, with the price dropping even further, by 60%, during the 12 March market crash.
However, the Bollinger Bands and the CMF indicator in the above chart pointed towards an upward breakout for ETH in the coming days. The CMF indicator lay above 0.08, indicating bullish momentum and the Bollinger Bands were widening, highlighting an increase in volatility.
Resistance: $159.32, $203.59, $286.60
Support: $121.57, $100.92
Press time price: $141.16
Market Cap: $15,640,109,272
24-hour Trading Volume: $15,032,923,042
Lisk
Source: Lisk/USD, TradingView
Similarly, Lisk also had a good start in January, but it started a bearish run on 15 February, with the token trending downwards since. As seen in the above chart, the price dropped by 56% on 7 March; however, it recovered and rose up by 63% on 17 March and it has been maintaining the support at $0.9. Additionally, the Stochastic oscillator indicated an ‘overbought’ phase.
Resistance: $1.2, $1.4. $1.8
Support: $0.9, $0.75, $0.69
Press time price: $0.98
Market Cap: $121,452,600
24-hour Trading Volume: $4,392,663
Ontology
Source: ONT/USD, TradingView
Ontology has been in the news lately in light of its collaboration with U.S-Asia custody solutions. The coin has also been doing okay in terms of price. After the big fall that cost the token 69% of its value, the coin recovered and maintained its support at $0.33. The above chart indicated the formation of a descending triangle, implying a downward price breakout, with the Awesome oscillator indicator further confirming the bearish breakout.
Resistance: $0.40, $0.53, $0.66
Support: $0.33, $0.30, $0.27
Press time price: 0.38
Market Cap: $245,144,637
24-hour Trading Volume: $82,863,495

