Ethereum
Ethereum’s long-term bullish pattern might be invalidated by death cross

The cryptocurrency market has been struggling to gain bullish price movement after the massive fall on September 24th, which saw Bitcoin and major altcoins lose their value in double digits. Since then the market has not seen any significant surge in prices, as the wave of market corrections often neutralized the small gains.
Ethereum the second-largest cryptocurrency by market cap was struggling as well, it was trading at $175.20 at press time with a fall of 0.11%. on the 24-hour price chart.
1-Day Price Chart

Source: ETH/USD on TradingView
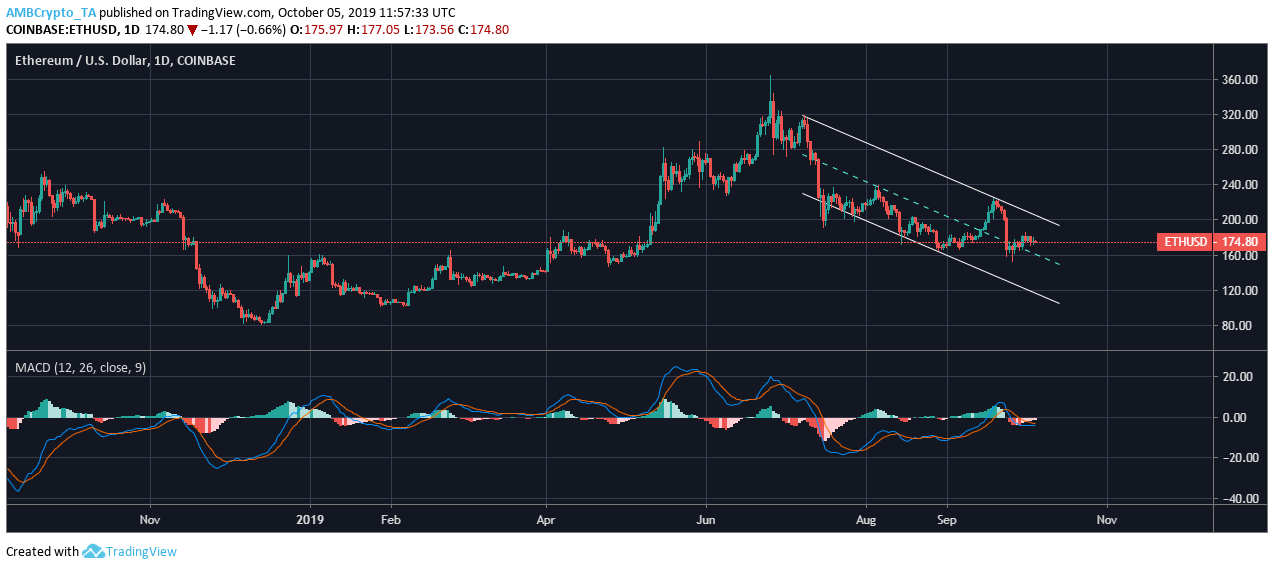
On the one-day price chart, Ethereum was forming a descending channel characterized by two parallel lines, where lower highs were formed at $314.81, $226.18 and $222.79. The lower lows were seen at $212.63, $181.58 and $163.51. Although a descending channel is often followed by a bullish breakout.
However, MACD indicator showed that MACD line continued to move below the signal line ever since a bearish cross over on September 24th, thus suggesting a bearish momentum in the market.
The death cross might plunder the prices further
Source: ETH/USD on TradingView
Looking at 50-day moving average and 200-day moving average, Ethereum witnessed its second death cross since inception on 4th September, The moving average suggested that ETH might struggle to see a bullish momentum
The death cross occurred in the middle of the ascending channel, which suggested that even though ETH might see a bullish price breakout, it would not be a significant or strong one.
Conclusion
Ethereum looks bearish in the long term despite the formation of a descending channel, but the death cross might be a dominant force and plunge the prices in the long term.

