Ethereum’s consolidating price may rise further with breach of ascending triangle

Ethereum’s performance in the month of September ended on a strong note, as the second-largest coin noted over 8% in gains, unlike major coins like Bitcoin and XRP. Even though the coin had breached a rising wedge in September and slumped by over 30%, the coin’s performance remained in the green.
The long-term chart of ETH predicts a green wave returning to the market as the coin prepares for a price boost.
1-day

Source: ETH/USD on TradingView
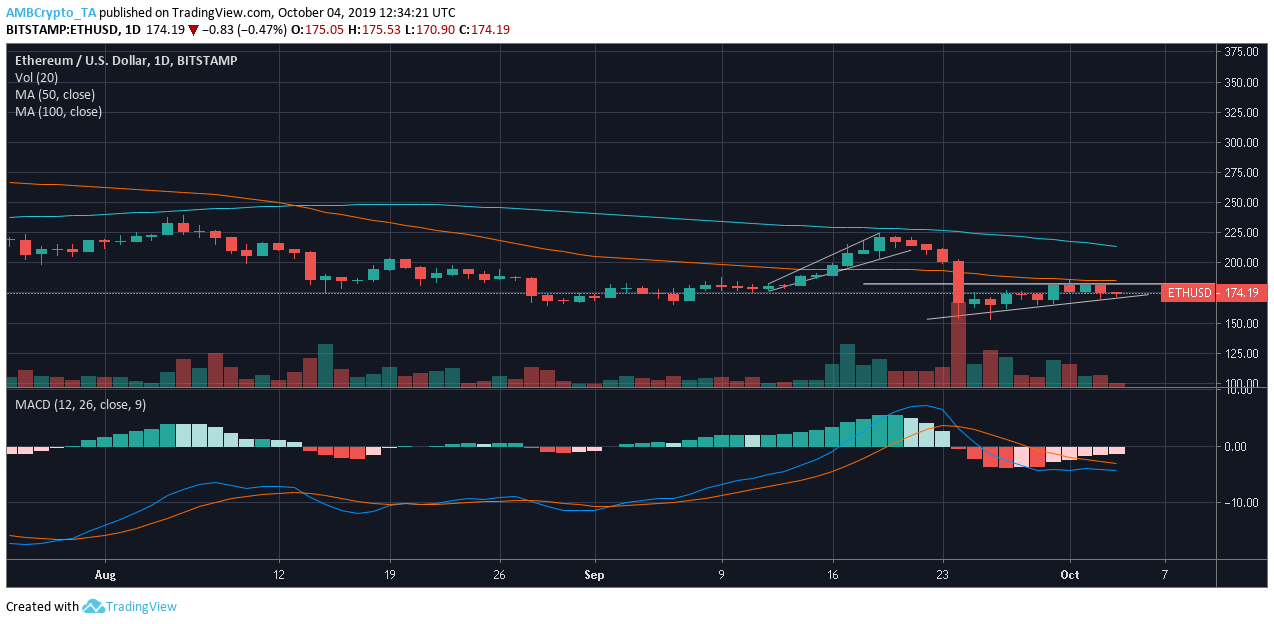
The daily chart for ETH reflected the formation of a bullish ascending triangle pattern. The pattern was characterized by two trend lines, one which bridged the higher lows at $157.13, $160.45, $166.25, and $169.57, while the horizontal line marked resistance at $182.51. The volume of the second-largest coin was observed to resonate with the consolidating price, affirming the pattern. As the price consolidated further and reached the end of the triangle, a positive breakout may be expected.
Previously, ETH had breached the rising wedge pattern that connected the higher highs at $182.85, $217.71, and $227.66 and higher lows at $177.09, $195.30, and $203.60. The breach led to the fall of the coin by 30%, with the coin falling to $152.71 from $222.01.
At press time, the 50 moving average resided under the 100 moving average above the candlesticks, indicating a bearish market. This was confirmed by the MACD, which also lay under the signal line and marked a bearish hold on the market.
Conclusion
According to Ethereum’s daily chart, a bullish breakout is expected as the coin breaches the ascending triangle. Meanwhile, ETH was valued at $174.16 with a market cap of $18.93 billion, at press time. The 24-hour trading volume of ETH was reported to be $6.53 billion as it noted a meager fall of 1.01% over the past 24 hours. However, the coin had gained by over 5% over the week.


