Ethereum short-term Price Analysis: 3 November

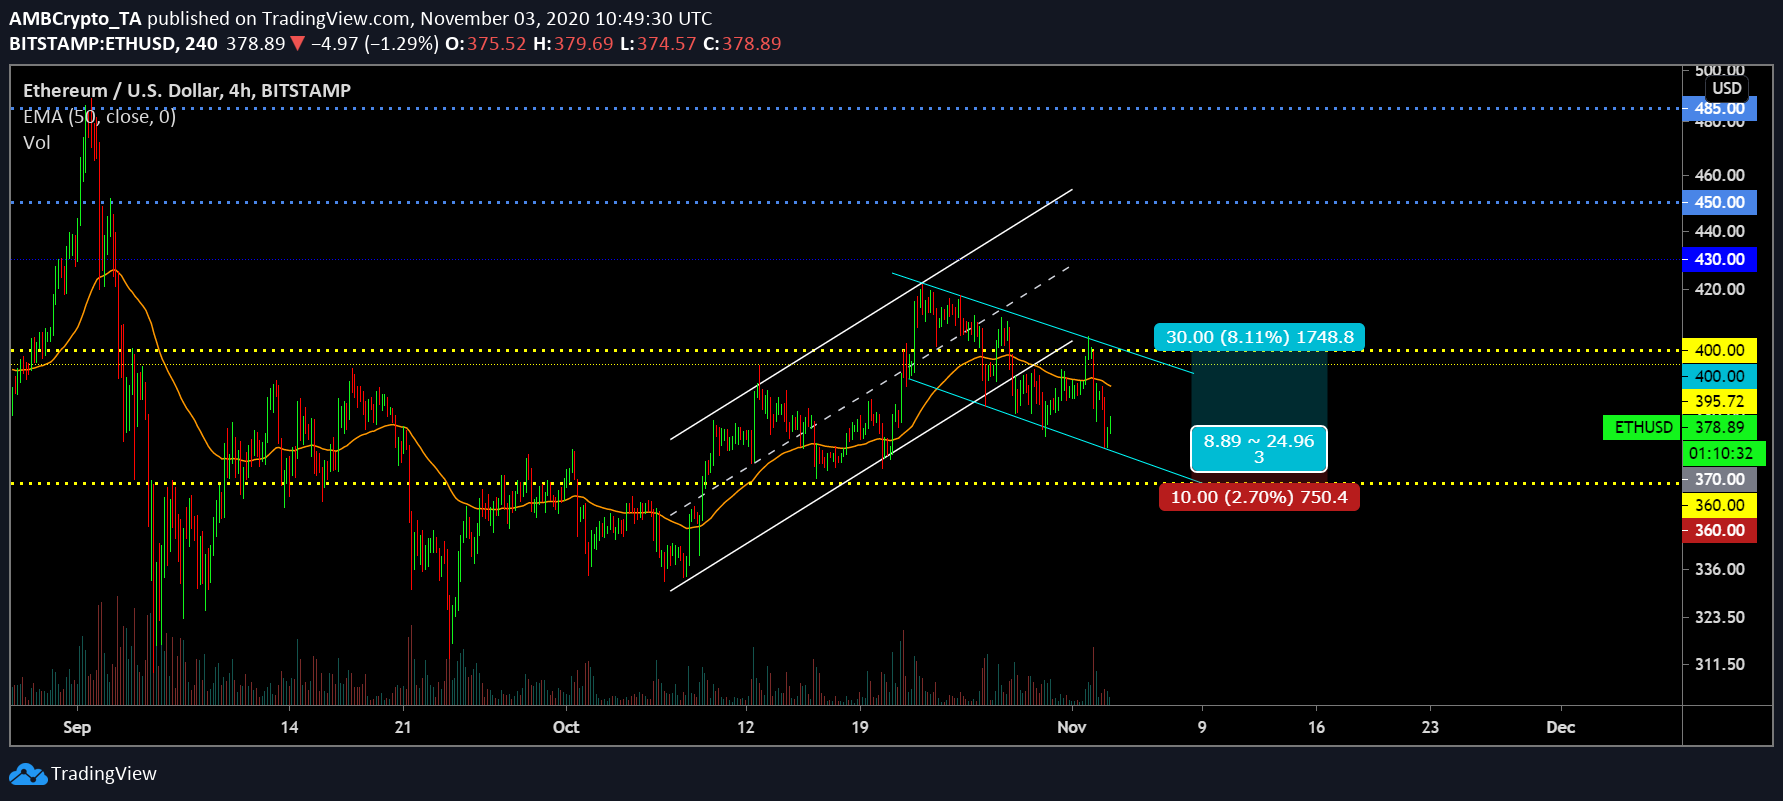
Ethereum is currently undergoing a massive short-term collapse as the price dropped down to $378 from $400 within 36 hours. While there might be more correction following up on this bearish trend, a quick turnaround from $370 is a likely scenario as well.
Ethereum 4-hour chart

Source: ETH/USD on Trading View
The 4-hour chart is exhibiting a massive confluence between two price patterns at the moment. While the valuation rose in the charts over the past month within an ascending channel, it entered a breakout, and then, the asset manifested a descending channel. Right now, the price mediation for Ethereum is still on a decline but the pattern holds bullish implications.
While the 50-Moving Average is also thrusting bearish pressure, the asset is still most likely retrace back to $400 over the next few days. The trading volume was on a decline over the past 2 weeks, which is in a linear motion to the price.
Reasoning

Source: Trading View
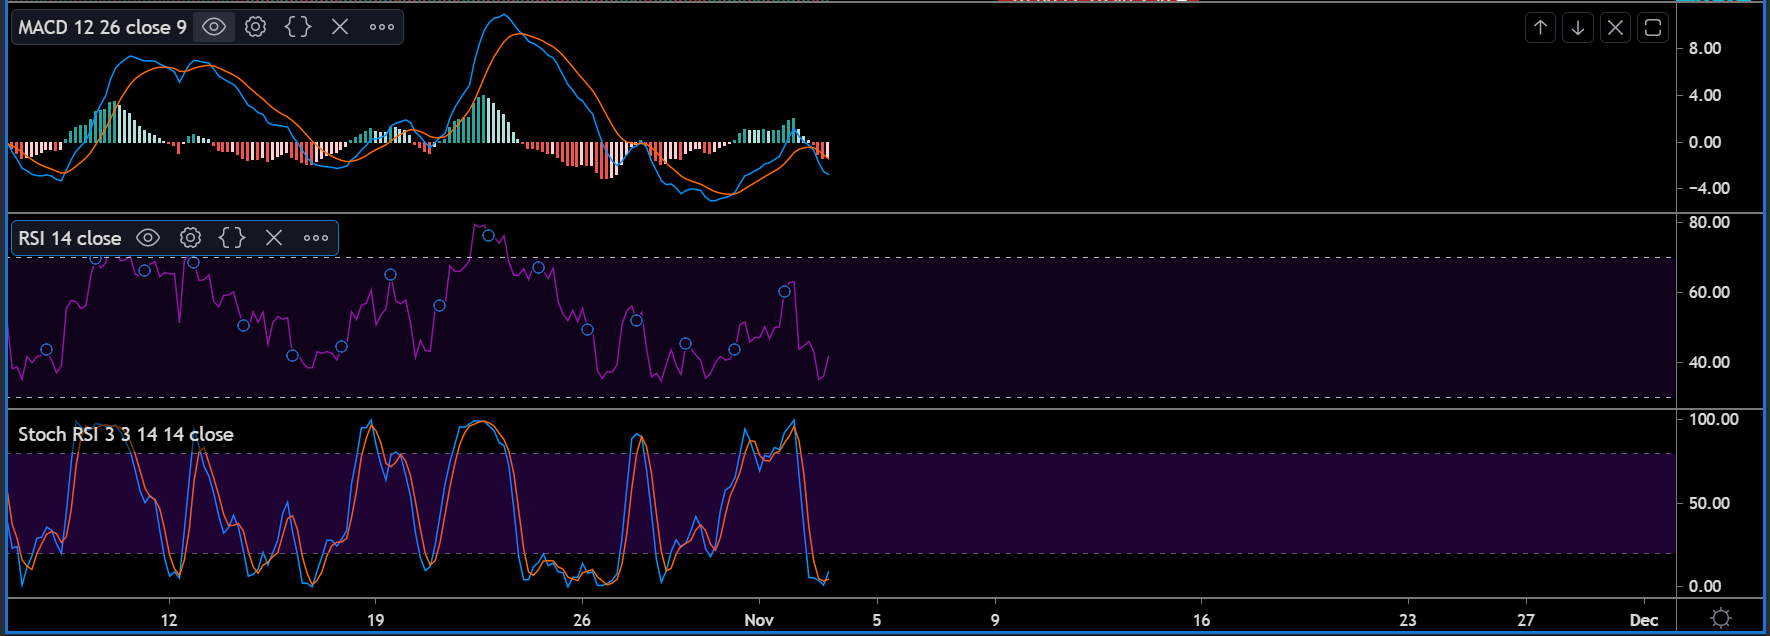
Right now, market indicators are holding a bullish narrative as well. Relative Strength Index or RSI is currently on a rise again after strong selling pressure depreciated ETH’s value. Stochastic RSI indicated a clear transition as well, with the blue line completing a bullish cross over with the orange line.
Lastly, MACD was a little bearish at the moment, as the trend continued to deal with the present collapse down to $378.
Important Levels
Resistance: $400, $380
Support: $360
Entry for a Long-Position: $370
Stop Loss: Either $360 or $350
Take Profit: $400
Conclusion
While there was immense volatility in the chart, Ethereum is likely to follow up with a strong recovery after attaining its recent lows. A pullback upwards is imminent with the immediate target being $400 in the short-term.


