
In the previous two articles, we laid down the premise and scaled-down the time periods to understand when you should buy Bitcoin. In this article, we’ll narrow it down to quick and frequent moves with a surprising result and layout the conclusions.
Like before, the rules at the start are maintained for this iteration which will look at two indicators, the 50-day moving average (7DMA) and the 7-day moving average (7DMA). Let’s see how it turned out.
50-day moving average
The 50DMA is important in pairing with the 200DMA, as it forms the golden and death crossovers. More than that it forms a good base to build an effective short-term price momentum strategy as it indicates a strong upward or downward price movement for over a month. So, how often would you end up buying Bitcoin in 2020 using the 50DMA?
| 50DMA | Value |
| No of buys | 304 |
| Average price | $ 9,983.11 |
| Entries | 6 |
| Exit | 5 |
| Total moves | 11 |
| Price per move | $ 907.56 |
| Profit (against 30 October) |
35.2% |
| Profit per buy | $ 32.84 |
As with the switch from 150 to 100, the move down to 50 has decreased our profits and increased our buy counts and moves. For a total of 304 trading days, Bitcoin’s daily price has traded above its 50DMA in 2020, broken up as 6 entry positions, and 5 exit positions. Firstly, the entry positions, or simply the ‘press play’ on your DCA button started as early as 6 January and were very on and off, meaning the tendency to check and change your DCA was frequent. Further, you would have exited or ‘press pause’ on your DCA button and stop buying Bitcoin 5 times in the year, taking your total moves to 10. On the bright side, you’d pull down your average buying price to $9,983.
You’re not in the clear yet. Despite the buying price being lower than the previous scenarios, and your profits at 35.2 percent against the price of BTC on 30 October, your absolute profits aren’t higher. Firstly, since you are making a total of 304 buys, increasing the average count of your profits, the profit per buy comes up to $32.8, lower than the three previous scales. Additionally, the price per move, drops down to $907.5, for the 11 moves at an average price of $9,983. Like before, the smaller the time period, the less the price momentum and the lower the profits.
7-day moving average
At first, this was just added as a cautionary tale, but it turned out to be an outlier. The 7DMA, or simply the moving average on a weekly basis is the shortest of the lot but doesn’t follow the trend we’ve been seeing. Until now, with every drop in period i.e. from 200DMA down to 50DMA, the profits have dropped, but not for the 7DMA. So, how often would you end up buying Bitcoin in 2020 using the 7DMA, and how does it fare?
| 7DMA | Value |
| No of buys | 172 |
| Average price | $ 9,661.24 |
| Entries | 25 |
| Exit | 24 |
| Total moves | 49 |
| Price per move | $ 197.17 |
| Profit (against 30 October) |
39.7% |
| Profit per buy | $ 56.17 |
Unsurprisingly, with the 7DMA, you’d end up making a lot more moves but surprisingly, you’d end up buying Bitcoin on fewer days. For instance, Bitcoin traded above its 7DMA for just 172 days in the first 10 months of the year. This gives you a total of 49 moves, split almost evenly between entries and exits. This means that you would’ve pressed play on your DCA 25 times and pressed pause 24 times. The average price for each of these 172 buys would be $9,661.2, notably lower than the previous four approaches, but that’s not all.
Not only is your profit margin at 39.5 percent, which follows the trend as we move lower down the period scale, but your profit per buy as well. Using this approach you’d end up with a profit per buy at $56.1, significantly higher than even the largest period scale used i.e. 200 days. This means that even with a shorter trend, giving you a lesser degree of price momentum, the 7-day trend bears substantially higher profits. which is astounding in and of itself, but looks even better when laid out together as we’ll see below.
Fine print
The motive of this exercise was to understand when is the right time to buy Bitcoin and hold it, using just one indicator (scaled across time period), and dollar-cost averaging it throughout. While initially, the findings pointed to a clear relationship between the larger the time period / hence stronger the price momentum, and the greater the profit, the 7DMA has thrown it out of wack.
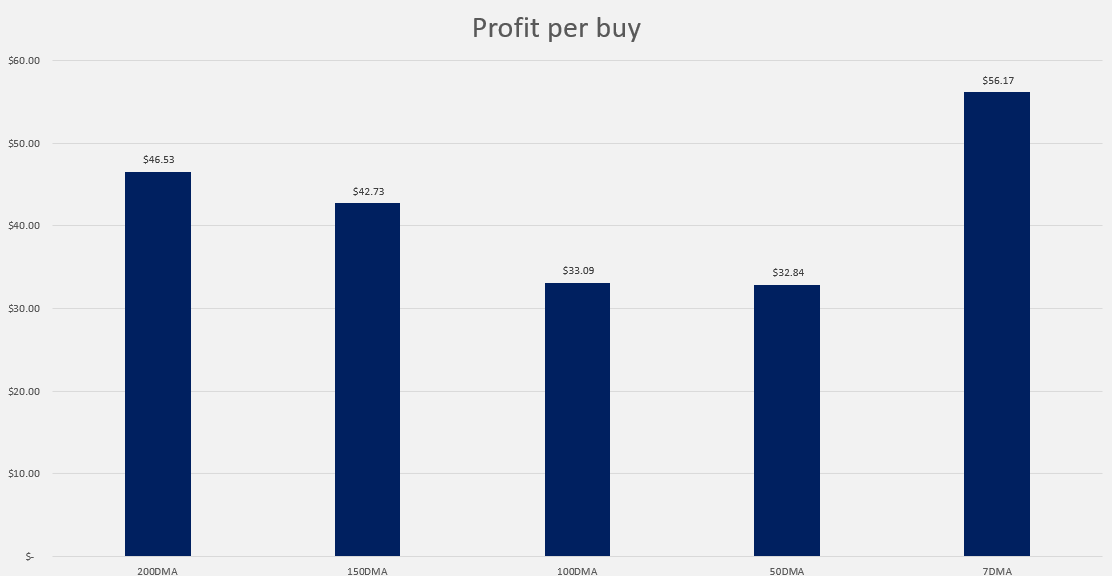
As can be seen in the chart above, the profit per buy decreases from the 200DMA down to the 50DMA, but the 7DMA indicates a much higher profit. The 7DMA, with its profit per buy at $56.1 is 20.6 percent higher than the 200DMA’s profit, not counting fees of course. Still, this means that riding on short-term price momentum, other things equal, from January 1 to October 30, the 7DMA would give you a higher profit per buy than any other moving average. However, you’d still have to contend with pausing and re-playing your DCA 49 times. A key reason for the high profit in the 7DMA is its lower trading days, seen below.
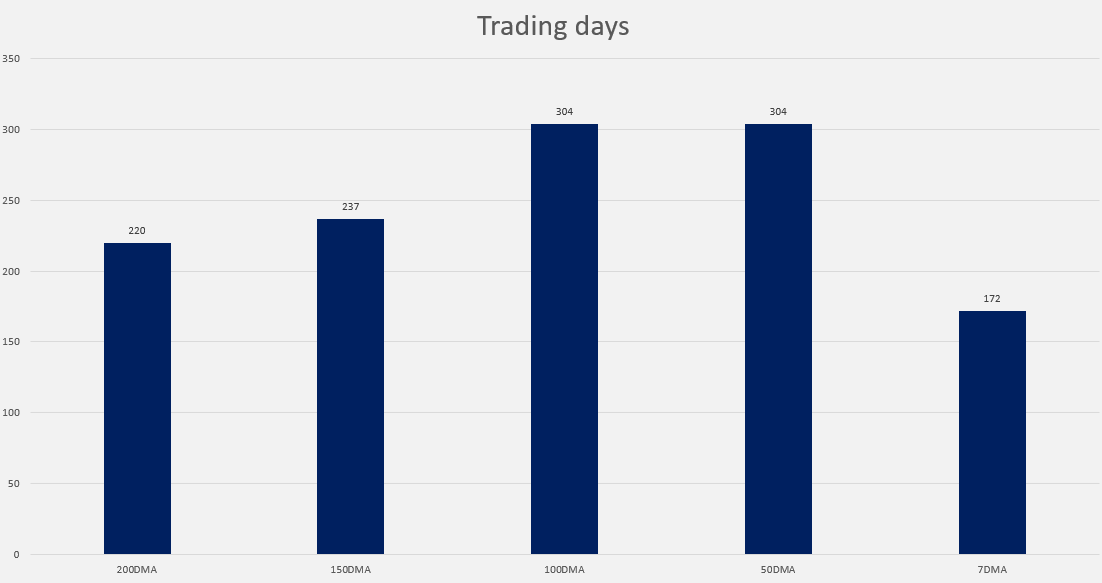
The chart above is practically the inverse of the profits per buy, showing the 7DMA with the least and the 100DMA with 172 active tradings, and the 50DMA with the most at 304 active trading days each. These two factors – increasing profit per buy, and decreasing trading days point to the overall theme of higher profit with lower trading activity, meaning that even if you were to modify your DCA strategy, using a moving average of your choice, the simple rule of ‘less is more‘ is bound to pay you more dividends.