
Disclaimer: The following price prediction should materialize in the next couple of weeks.
Ethereum recently broke back above $400 but doubts continued to surface as the price fell below the resistance again. The bearish pressure has been prevalent but over the long-term, once the pressure subsides, ETH is still at the right place in terms of its price valuation to register another new high in 2020.
At press time, Ethereum was valued at $395 with a market cap of $44 billion in the charts.
Ethereum 1-day chart
Source: ETH/USD on Trading View
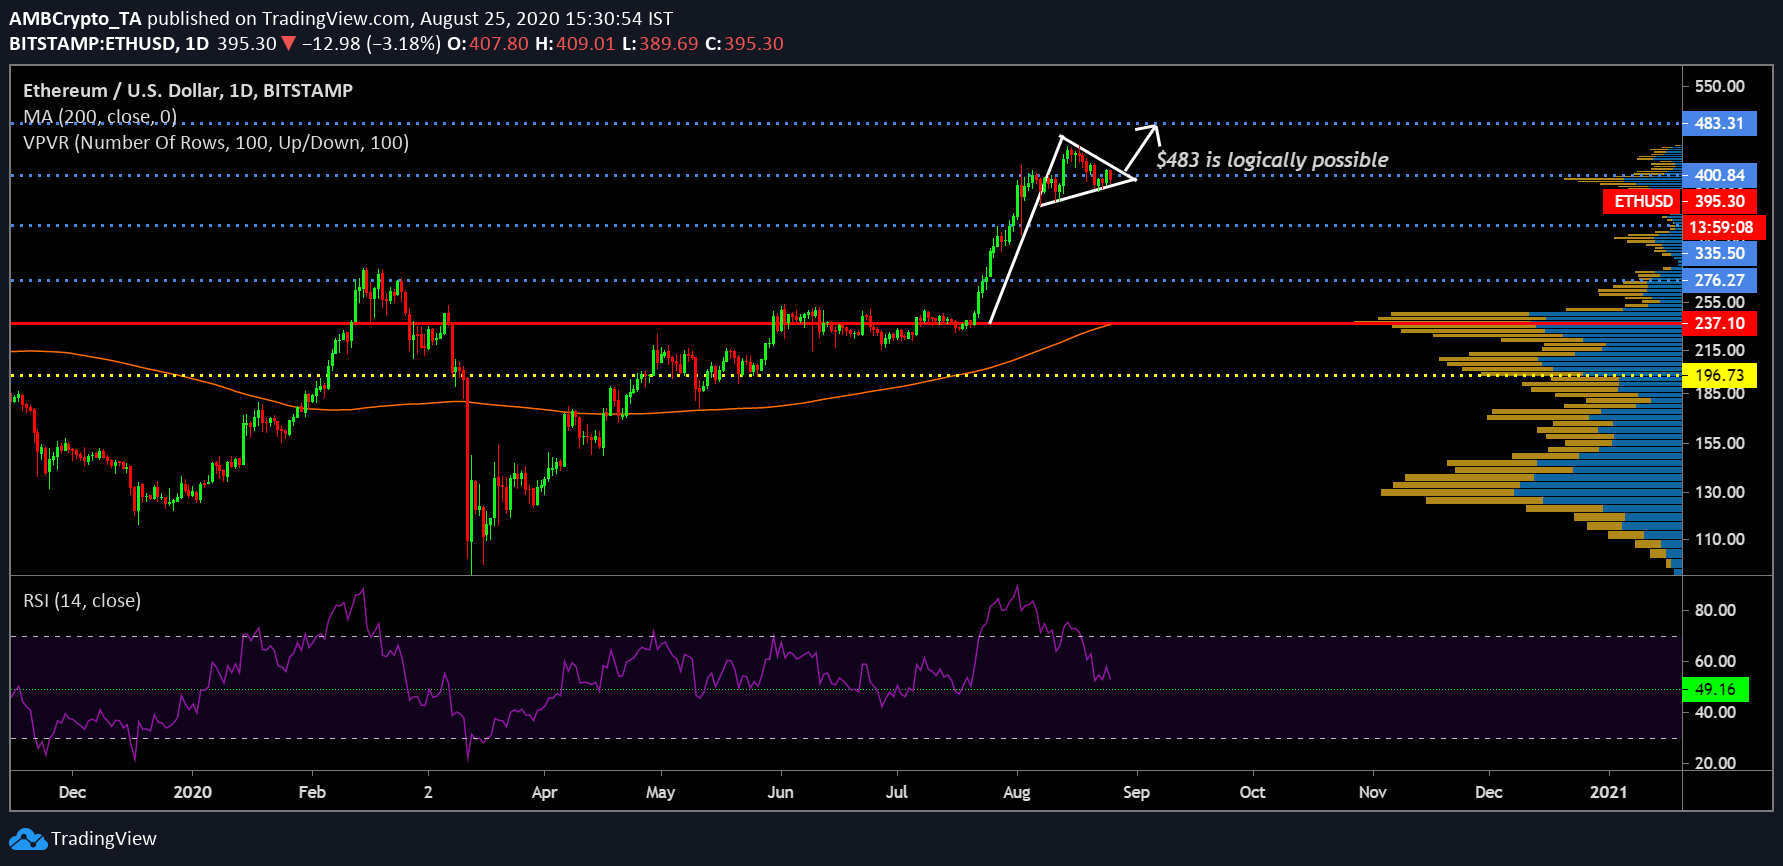
The 1-day chart of Ethereum screams bullish over the course of 2020. After the unceremonious crash in March, the asset’s valuation has only risen over the past six months. At the moment, if you analyze Ethereum’s movement since the end of July, the token is projecting the formation of a bullish pennant, which usually indicates bullish implications. The pattern further suggested that the breakout is possibly close taking place in the next couple of weeks or so.
Now, the current bearish dominance of the market has been accounted for but logically, the probability of Ethereum re-testing resistance at $442 is not out of the picture. Other indicators are suggestive of a long-term bullish trend is the presence of the 200-Moving Average, as underlying support.
With Relative Strength Index or RSI spending a majority of its time in the bullish realm since the start of April, the indicator is reaching a local bottom once again. Another retracement towards the top would assist Ethereum’s bullish prospect as well.
Ethereum 4-hour chart
Source: ETH/USD on Trading View
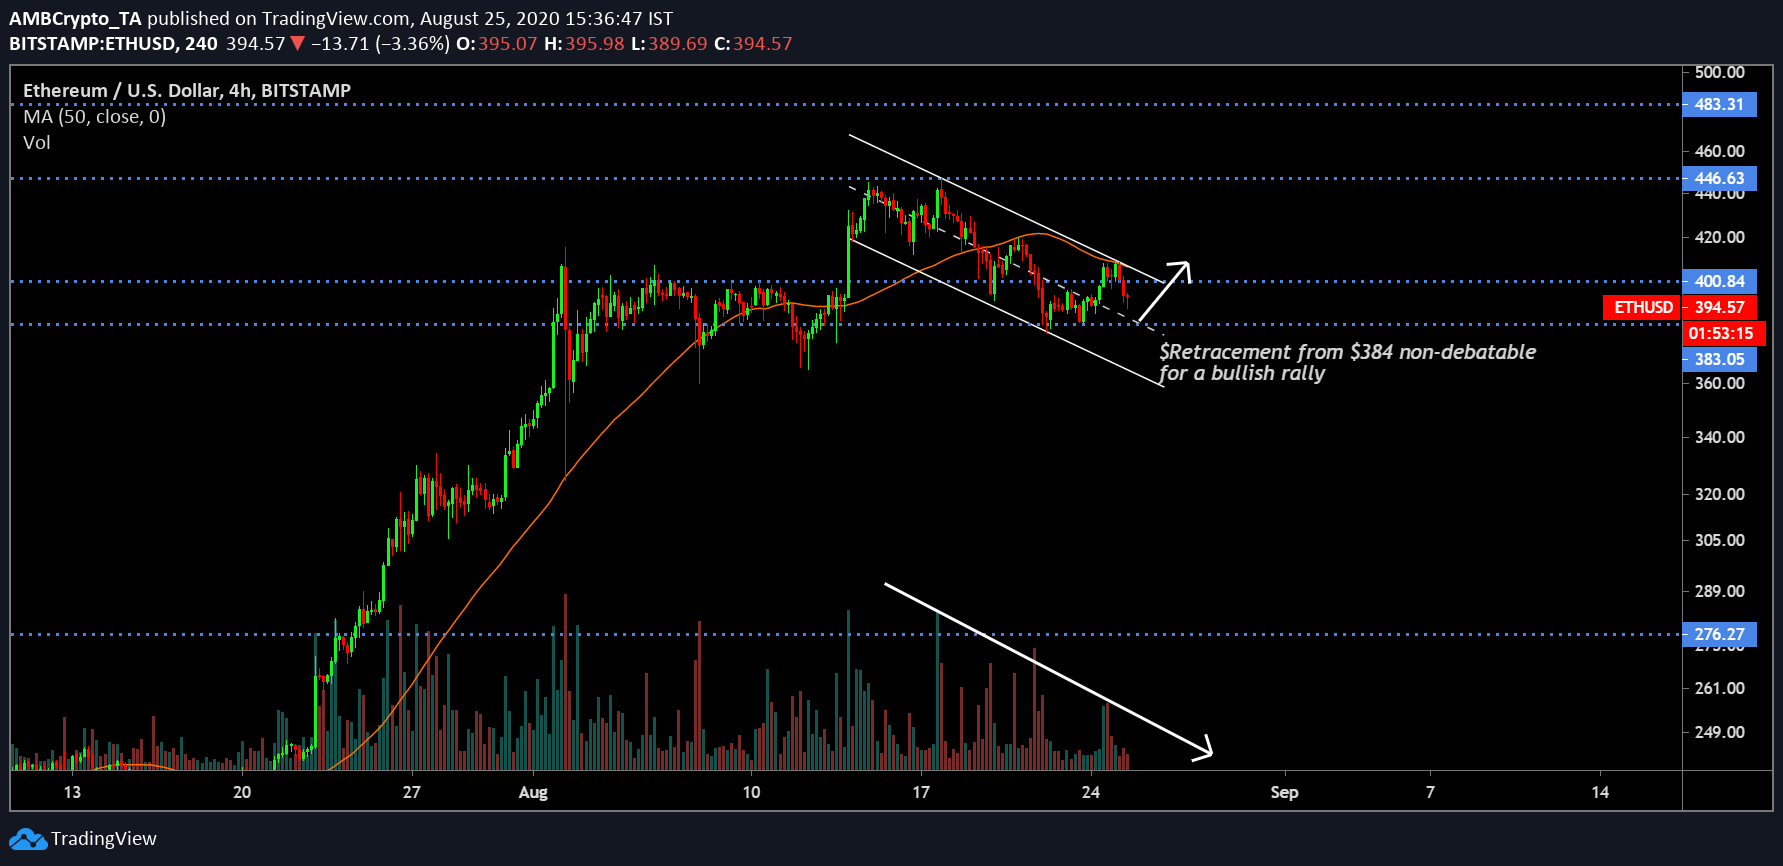
Now, on the 4-hour chart, the over-head resistance sustained by the 50-Moving Average continues to exhibit an extended bearish grip but the other patterns were in favor of a bullish reversal. Ethereum’s value is currently mediating between a descending channel and any favorable breakout from the pattern is necessarily upwards.
A decreasing trading volume also mirrored Ethereum’s value hence there wasn’t any bearish divergence in the charts. Considering, Ethereum does not configure a move below $383, Ethereum’s current price is possibly a temporary refuge and consolidation above $400 is largely certain in the next couple of weeks.