
Even with Bitcoin climbing over $12,000 for the second time in two weeks, most of the attention in the larger crypto-market is on its number two – Ethereum. The world’s largest altcoin was trading at just below $400, a two-year high, at press time, having eaten a significant chunk of the crypto-market’s dominance. With Bitcoin trading flat between May and July 2020, its dominance dropped from 67 percent to 60 percent, while Ethereum’s rose from 9 percent to 12.5 percent, even before the price did.
Looking at the long-term daily chart for Ether, the $400 surge has been met with some resistance. Ethereum ended July in blazing fashion, surging by a whopping 65 percent from $233 to $390 in less than 12 days. On 2 August, the market hit a snag, dropping below the support of $376 when Bitcoin saw a shock drop at $12,000. However, unlike its fellow altcoins, this bump did not curtail its rise as it just halted for a day.
In the three days after the drop, the charts saw three consecutive green candles that pushed the price to close to $400, before dropping by $20 a day later.
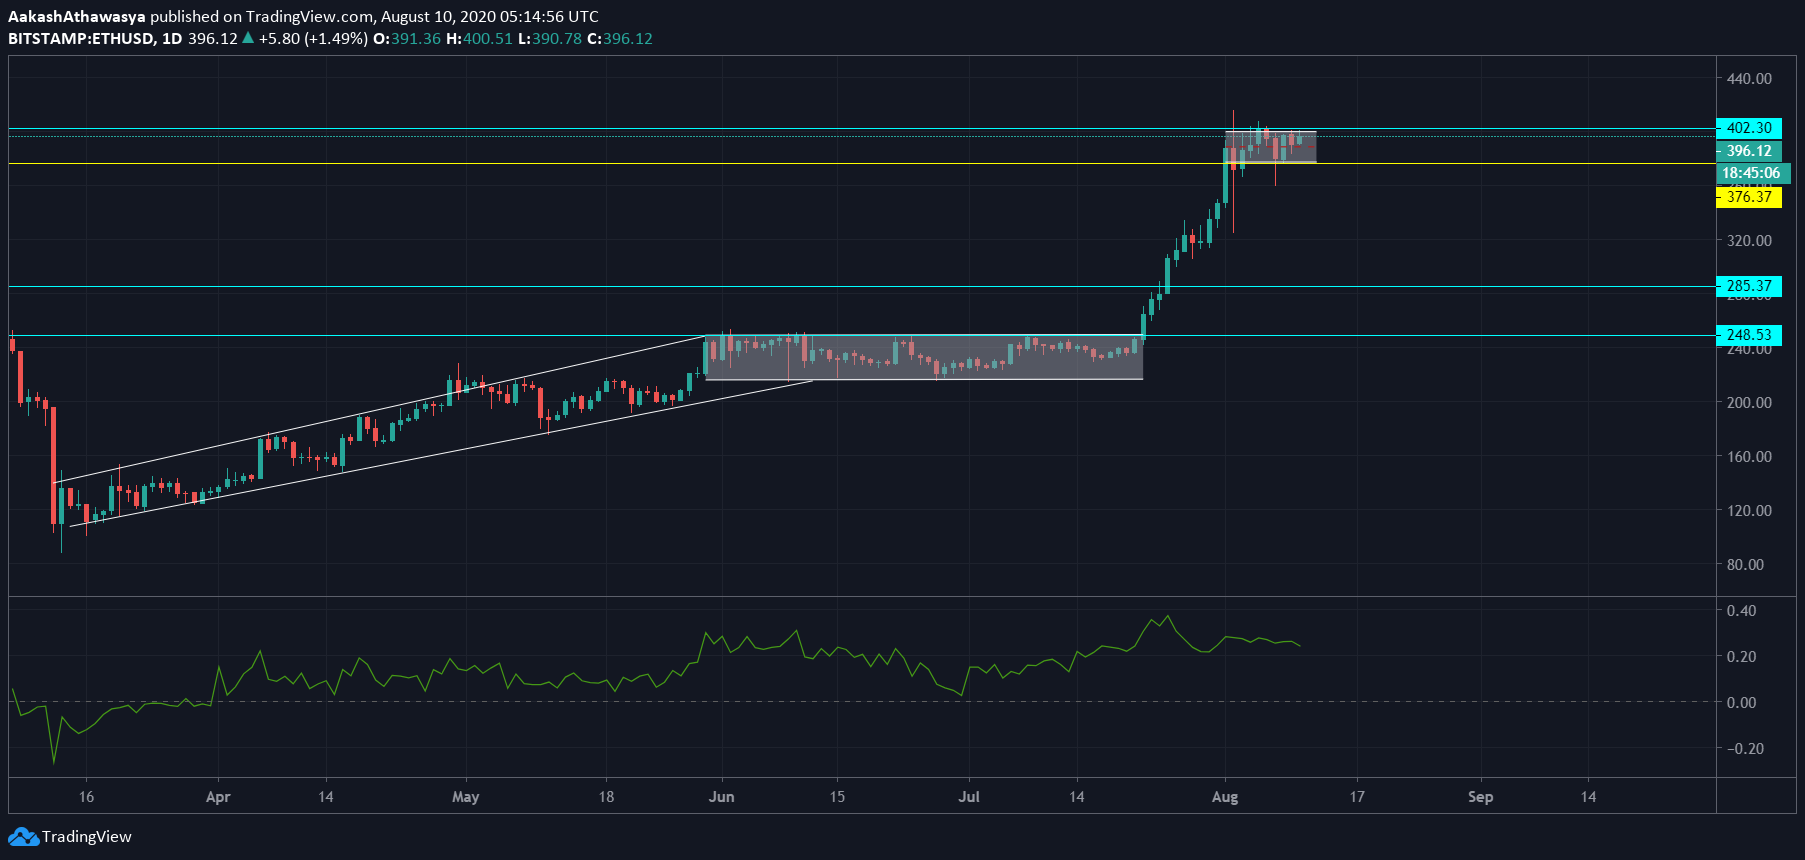
Source: ETHUSD via Trading View
As can be seen from the daily chart, the price push to $400 has been met with stiff resistance, forcing the altcoin to trade within a parallel channel in the $376 to $402 range over the past 10 days. Despite this resistance, the fact that the 2 August drop, the 3.5 million ETH sell-off, and the drop from $400 has not pushed it out of the range is a strong sign.
In June and July, a similar parallel channel was observed when the price was tussling with the $250 level, and the same was eventually shattered on 21 July, well before Bitcoin noted a surge on 23 July.
The Chaikin Money Flow indicator has been falling since 2 August, with cautious investors pulling their money out of Ether in fear of yet another drop. Hence, it’s no surprise that the CMF has dropped from 0.29 to 0.24 in the past week, but it is still well-positive and has represented a consistent positive net flow in the ETH markets since March 2020.
The current hurdle for Ethereum is $400, but whether it will consolidate above that is only something time will tell. If this takes some time, without external help or network developments, the aforementioned range of $376 to $400 will hold strong and a healthy trade volume of over $10 billion a day, rising market dominance, and positive money inflow will only help its market. There’s no worry of sideways movement as the likelihood of a drop, given the above factors holding strong, is slim.