Ethereum, Litecoin, Tron, Monero, Cardano Price Analysis: 13/09

After consolidating low in the charts for the past couple months, major altcoins were moving in a direction which could revive some of its early-year optimism. Bitcoin dominance was still above 70 percent at press time, as alts tried to make a comeback in the market. However, the surge may not prevail in the near future as patterns majorly indicated a move toward the bears rather than bulls.
Ethereum 4-hour chart
Source: Trading View
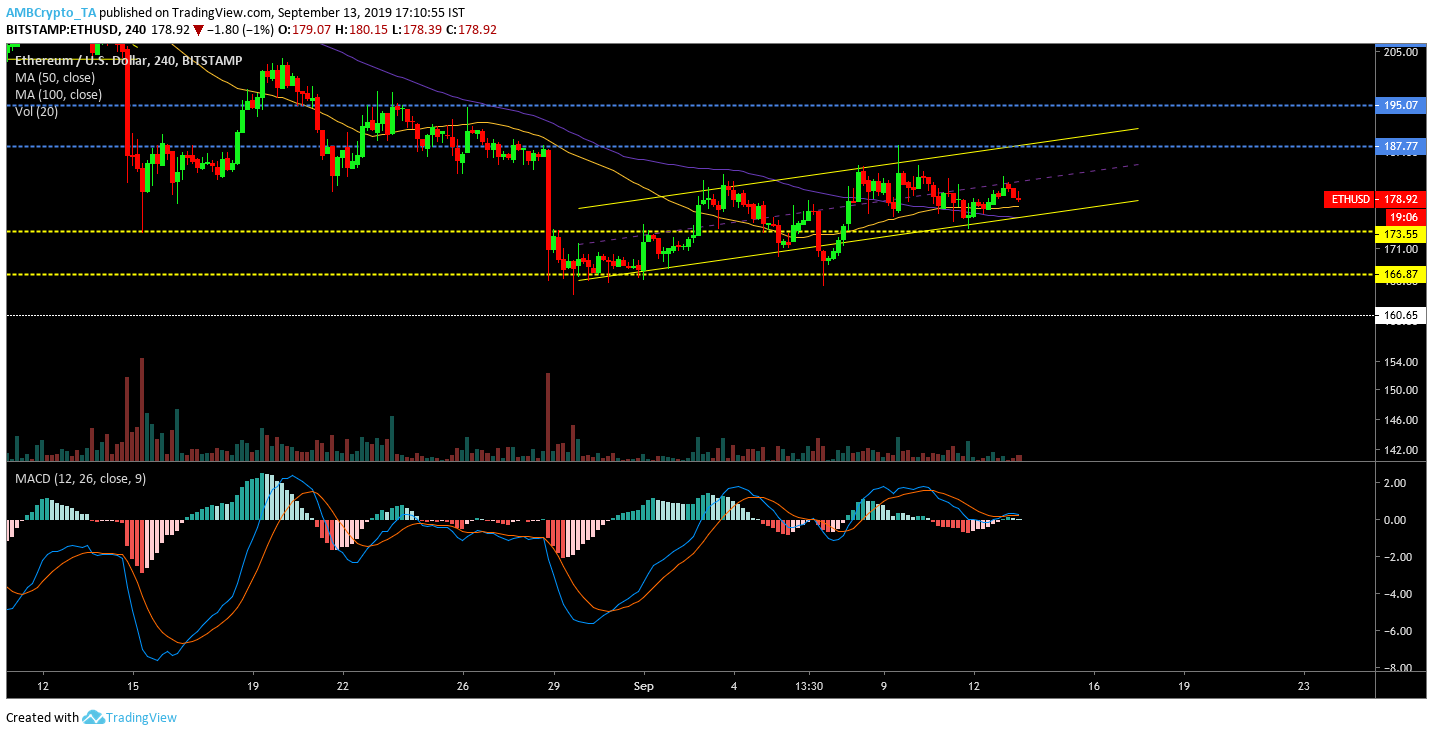
Ethereum [ETH] has been one of the few alts that exhibited bullish traits early in the week but the bullish momentum may have subsided at press time. 4-hour chart indicated formation of an ascending channel; an imminent bearish pullback could play out in the next few days but the drop should not be catastrophic. ETH’s price had strong support placed at $173.55 and $166.87, where the valuation should witness a bounce back.
MACD indicator also completed a bearish crossover, validating current short-term bear trend.
Litecoin 4-hour chart
Source: Trading View
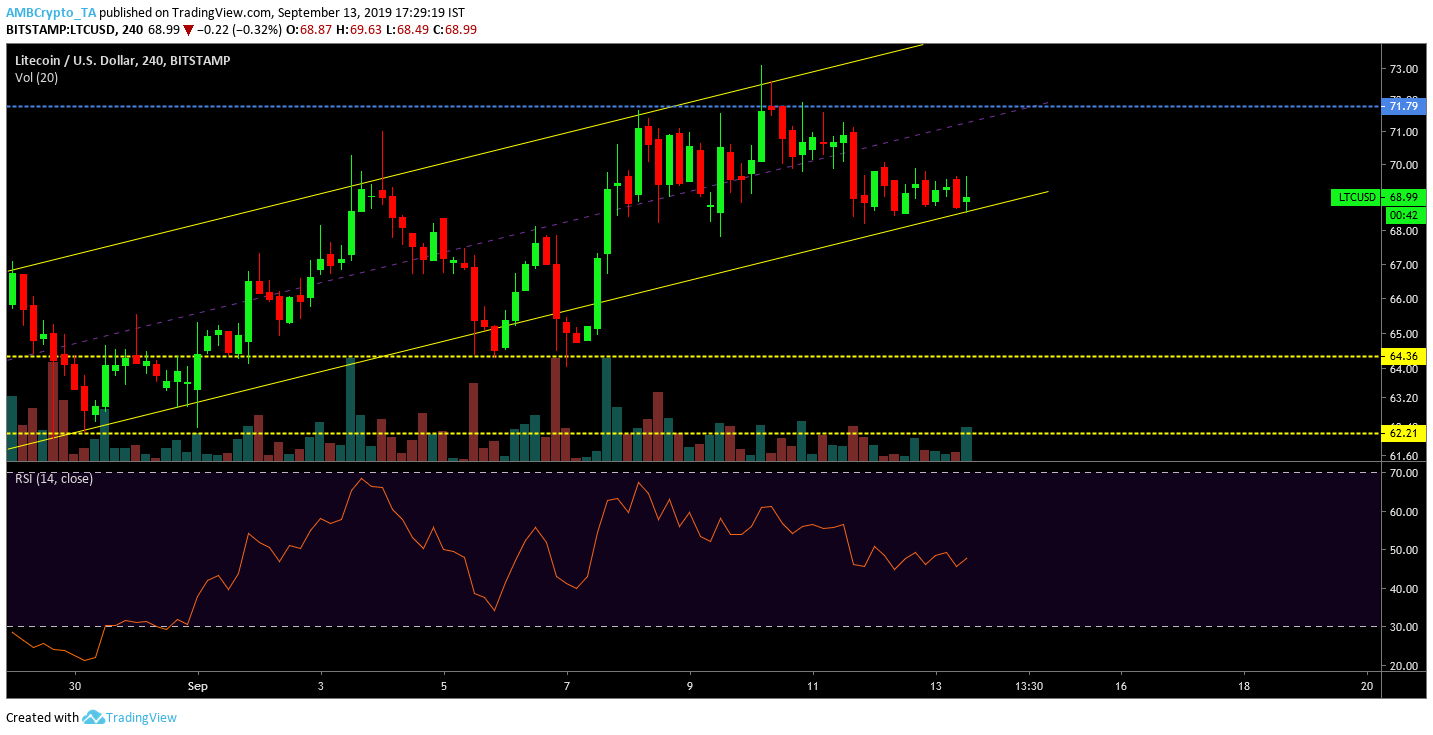
A similar situation followed for Litecoin’s [LTC] 4-hour chart after picturing an identical ascending channel pattern formation. LTC price has been consolidating low for a while now even though bullish signs were observed earlier on the 1-hour chart. The valuation on the 4-hour time scale navigated within the patterns and the predicted bearish drop is expected to see the valuation re-test support at $64.36. Dropping below the support of $62.21 would see Litecoin [LTC] consolidate down to a valuation last observed before 1st April.
The depreciating trading volume indicated bearish diversion but Relative Strength Index remained neutral at press time.
Tron 4-hour chart
Source: Trading View
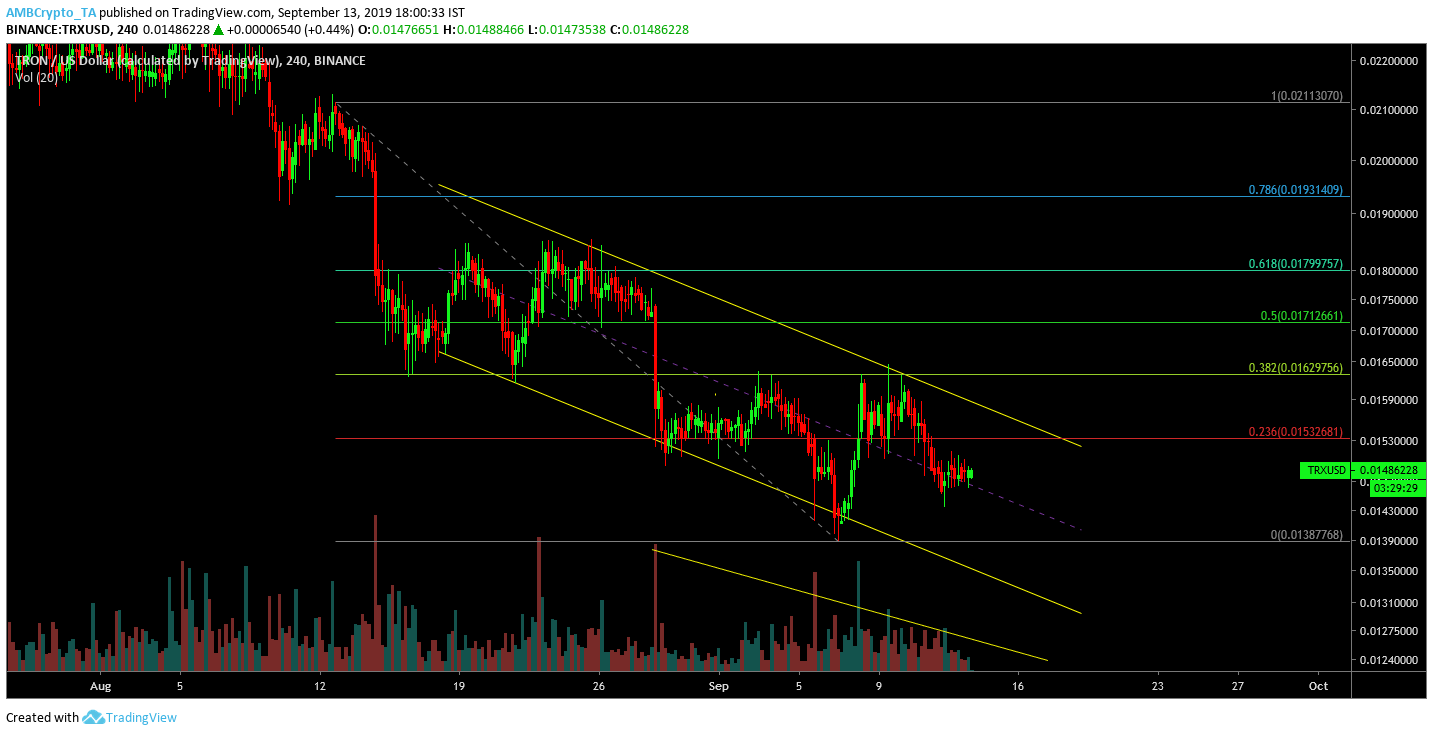
Tron [TRX] was no-longer in the top-10 cryptocurrency ranking. Major recovery or pullback did not surface either, as assets like Monero and Stellar moved ahead in terms of market capitalization. On the bright side, Tron’s price may soon exhibit a major bullish pullback. At press time, price indicated the formation of a descending channel which subsequently suggested a bullish pullback. The volume also decreased progressively in the charts validating the pattern formation.
According to Fibonacci retracement lines, the immediate resistances were spotted at $0.0152 and $0.0162. Strong bullish momentum should see the valuation test the aforementioned resistance.
Monero 4-hour chart
Source: Trading View
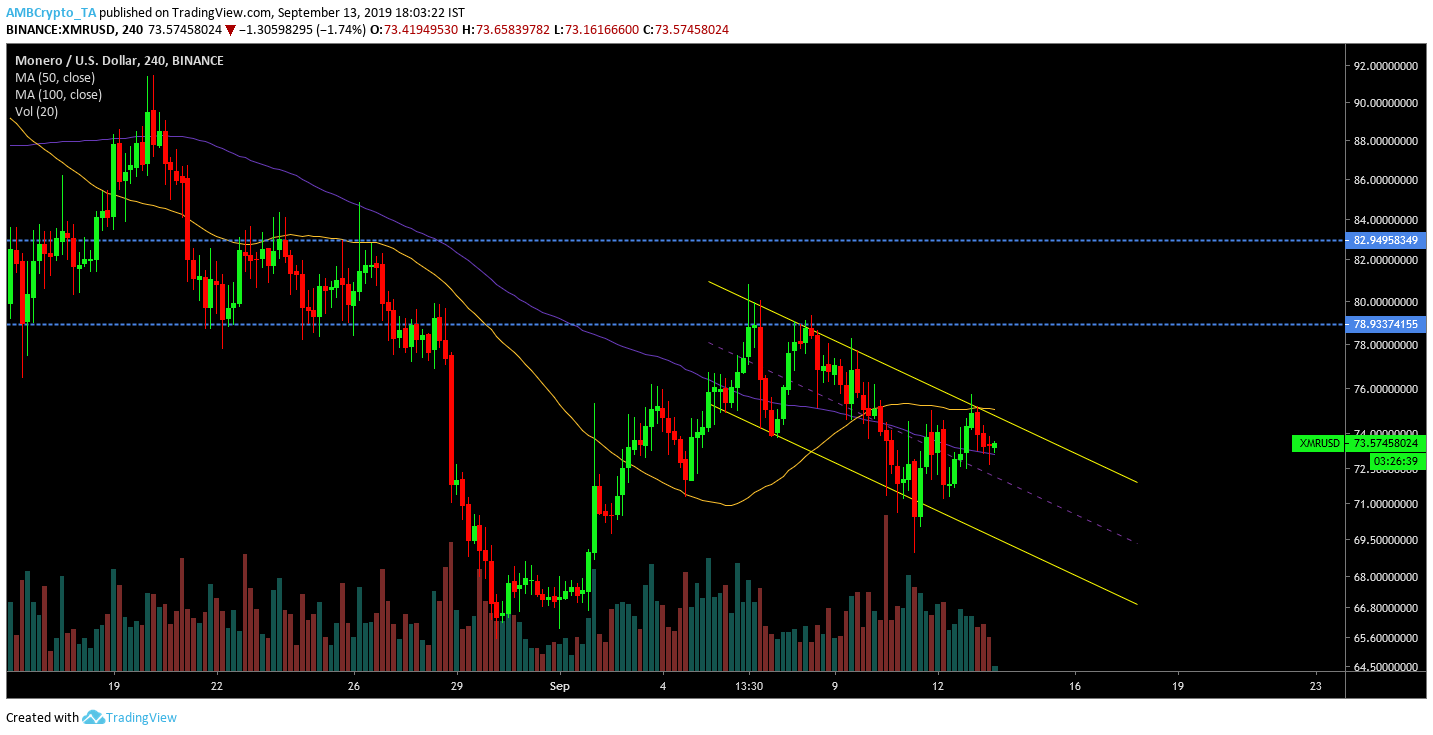
Monero [XMR] continued to exhibit bullish traits in the charts following the drop on 30th August. The price movement abided to the formation of a descending channel, which should be followed up by a bullish pullback. The immediate resistance was placed at $78.9 but the price failed to breach it on the last couple of times. The volume was consistent in the market but failed to indicate a clear trend with the pattern.
The moving average improved the possibility of a bullish break as the 50 and 100-moving average completed a bullish crossover at press time.
Cardano 4-hour chart
Source: Trading View
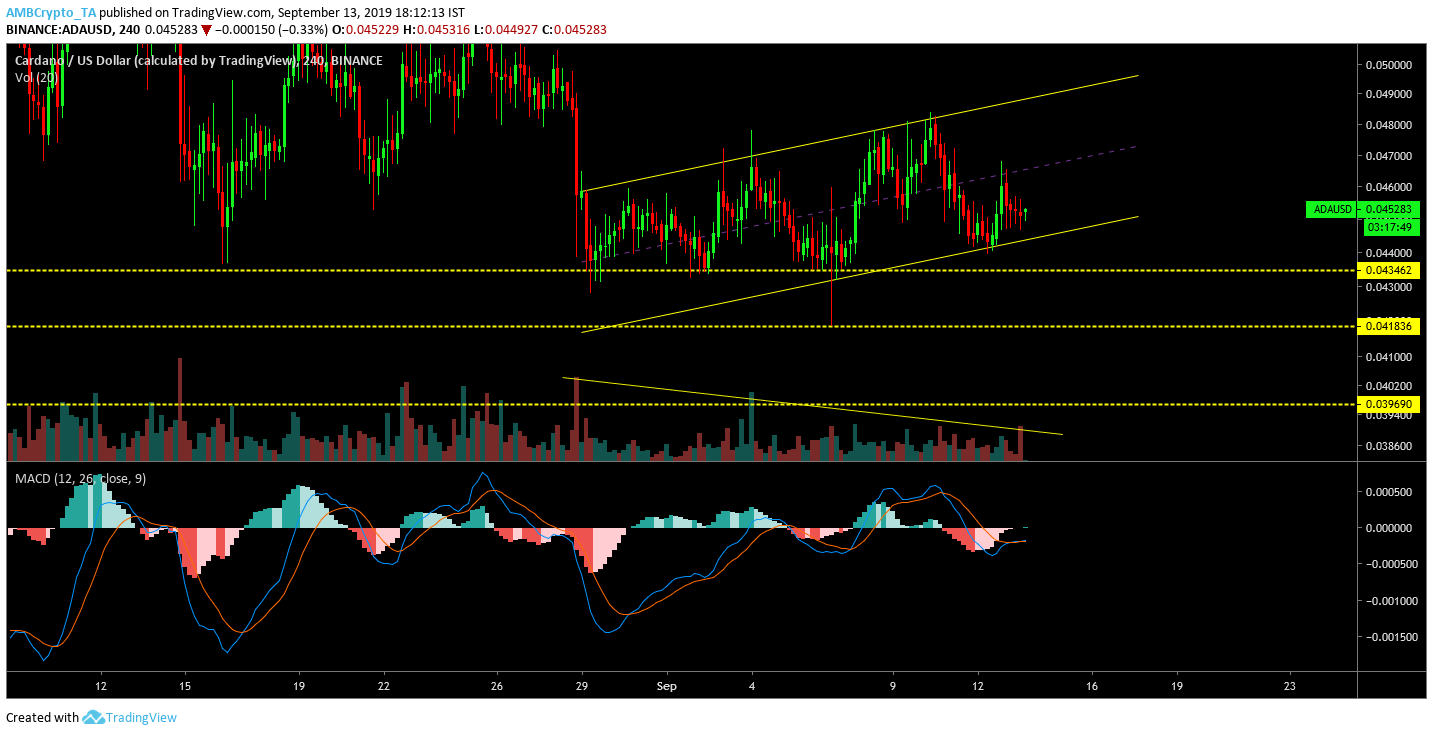
The 4-hour chart of Cardano [ADA] indicated further downfall for one of the most technically sound assets. At press time it was valued at $0.045 but the formation of an ascending channel pattern suggested depreciation in the future. Key supports were placed at $0.043 and $0.041 but greater bearish momentum could see the price test the long-term support at $0.039. Cardano price has been above the support 0f $0.039 since the start of March.
The reducing trading volume confirmed the bearish diversion in the charts and the MACD indicator also pictured a bearish trend.
