
Bitcoin is the king. With Bitcoin being the front runner and the most dominant cryptocurrency in the market, it has inevitably managed to influence other cryptocurrency assets with even its slightest price movements, particularly, the second-largest cryptocurrency by market cap – Ethereum.
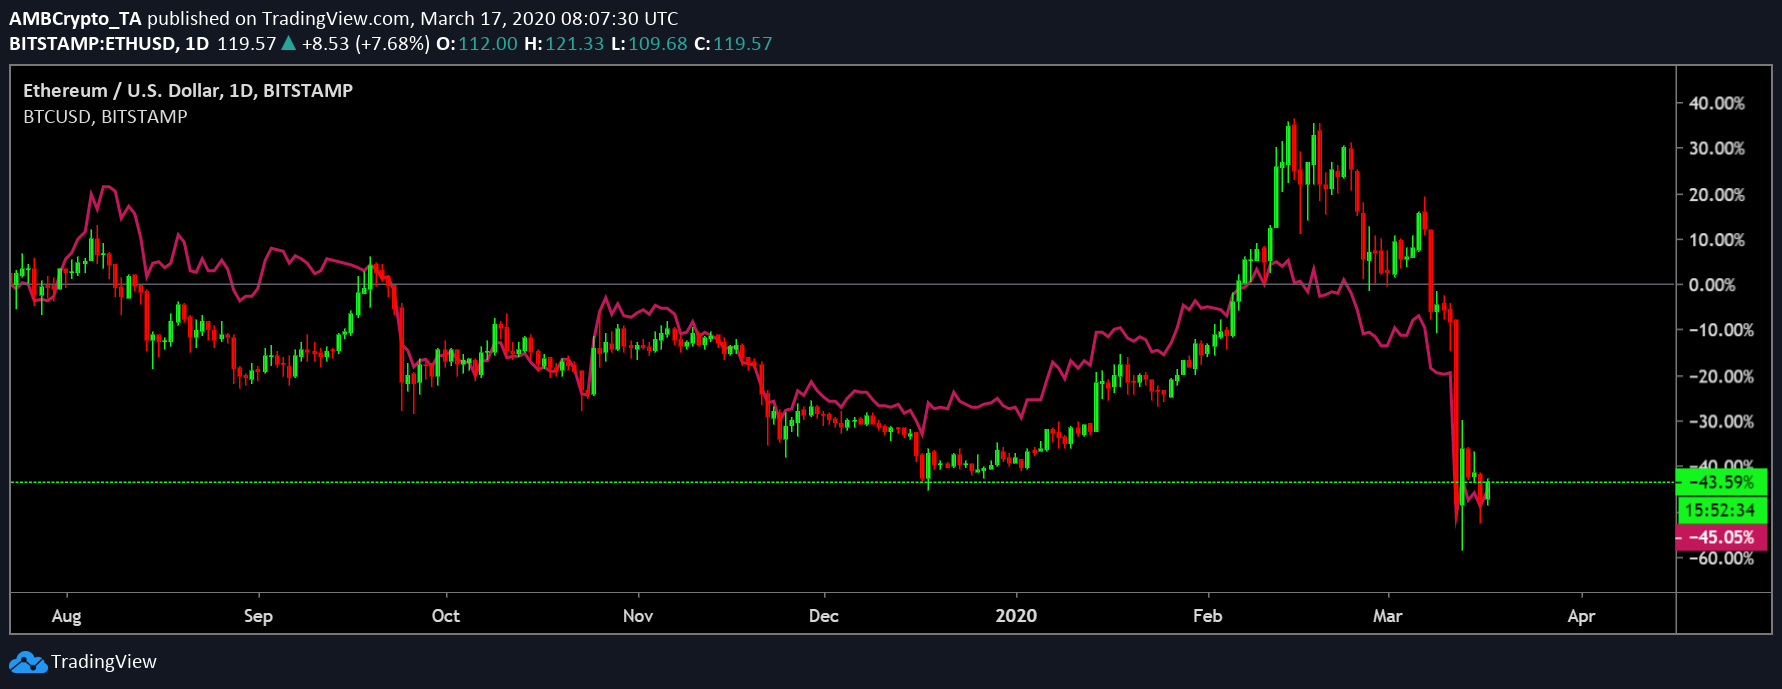
Source: ETH/USD on TradingView
Ethereum and Bitcoin have an interesting correlation pattern. According to the latest charts by Skew markets, the 1-month correlation between Bitcoin and Ethereum spiked to a whopping 96% on 16 March. This level of correlation was last seen almost a year ago on 27 March 2019, a day when the correlation figures were found to be at 97%.
While BTC–ETH correlation is instantaneous in most cases, however, over the past year, the correlation figures have seen a couple of significant drops. The biggest decline was observed on 17 May 2019 when the figures dropped to 50%. This was a time of high volatility, a time when Bitcoin sustained a correction from $8,000 to $7,100 in a period of just 24-hours, followed by a surge to its previous level above $8,000, the very next day.
During the same time period, ETH’s value dropped from $268 to $230, before bouncing back the next day.
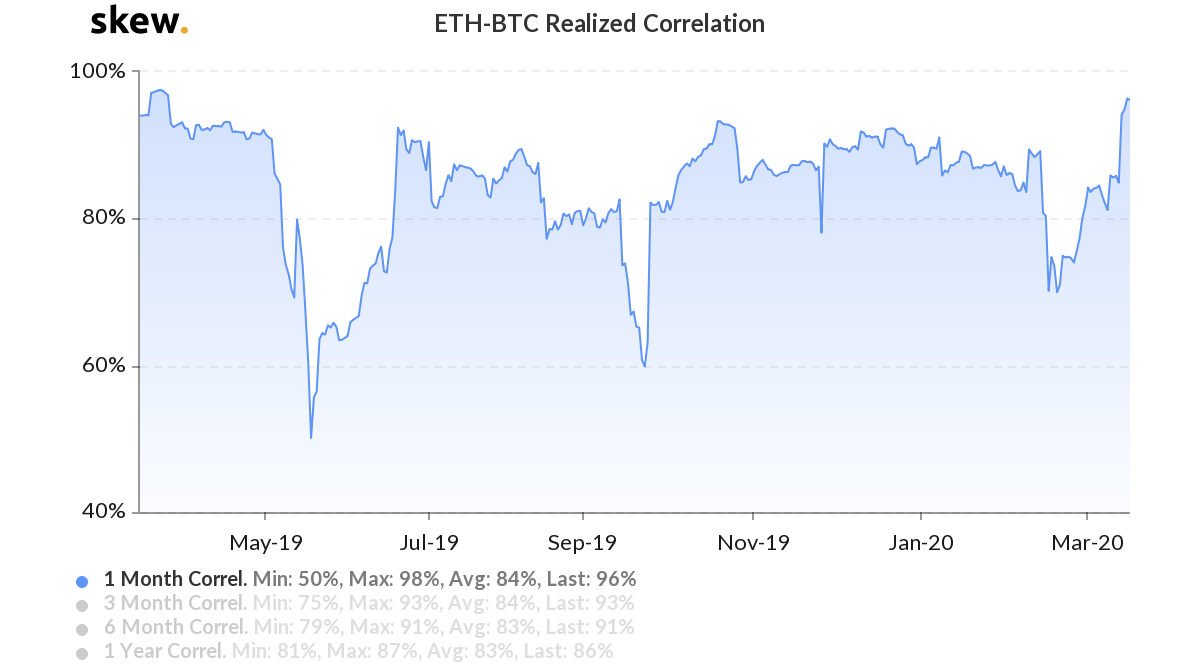
Source: Skew
The next drop was noted when ETH-BTC realized correlation fell abruptly to 60% on 23 September 2019, also during a time of high volatility. This was the time when Bitcoin fell from slightly above $10,000 to $8,000 and ETH registered a drop from $211 to $165, all in a period of just 24-hours.
After a period of decoupling, ETH’s price has started to mimic the movements of the king coin once again. Meanwhile, in addition to the 1-month correlation, the figures with respect to ETH-BTC’s 3-month and 6-month realized correlation have also spiked to 93% and 91%, respectively.
According to the CEO of the Three Arrows Capital hedge fund, Su Zhu, from 1 January 2017 to 1 January 2020, i.e out of the total 36 months, Bitcoin and Ethereum had opposing price movements for 9 months. He had previous stated,
“In Q1 of every yr since genesis, eth has had a month of up 30% while BTC was down in the same month. Incredibly, since Jan 2017 ETH makes all its gains from Jan-Jun each yr.”
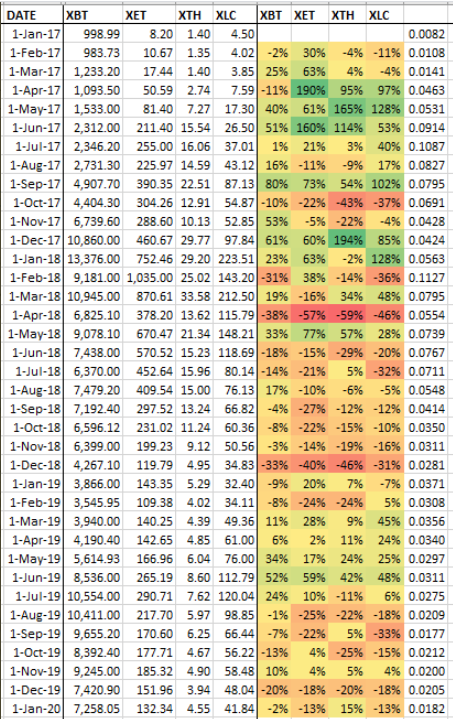
Source: Twitter | Su Zhu
A high correlation usually indicates a higher dependence of Ethereum on Bitcoin’s price movements. With respect to the diversification of an investment portfolio, an investor prefers assets with low correlation. However, in the crypto-realm, all the other assets have continued to closely follow Bitcoin’s price action.