Analysis
EOS, NEM, Zcash Price Analysis: 08 November

Bitcoin‘s price dropped from $15,600 to $14,310, with the cryptocurrency, at press time, trading at $14,992. This corrective move for BTC saw a volatility spike in the altcoin markets as well. While EOS and NEM noted minor pullbacks after a surge in price, Zcash was trading under an important level that could decide the direction of ZEC over the coming days.
EOS

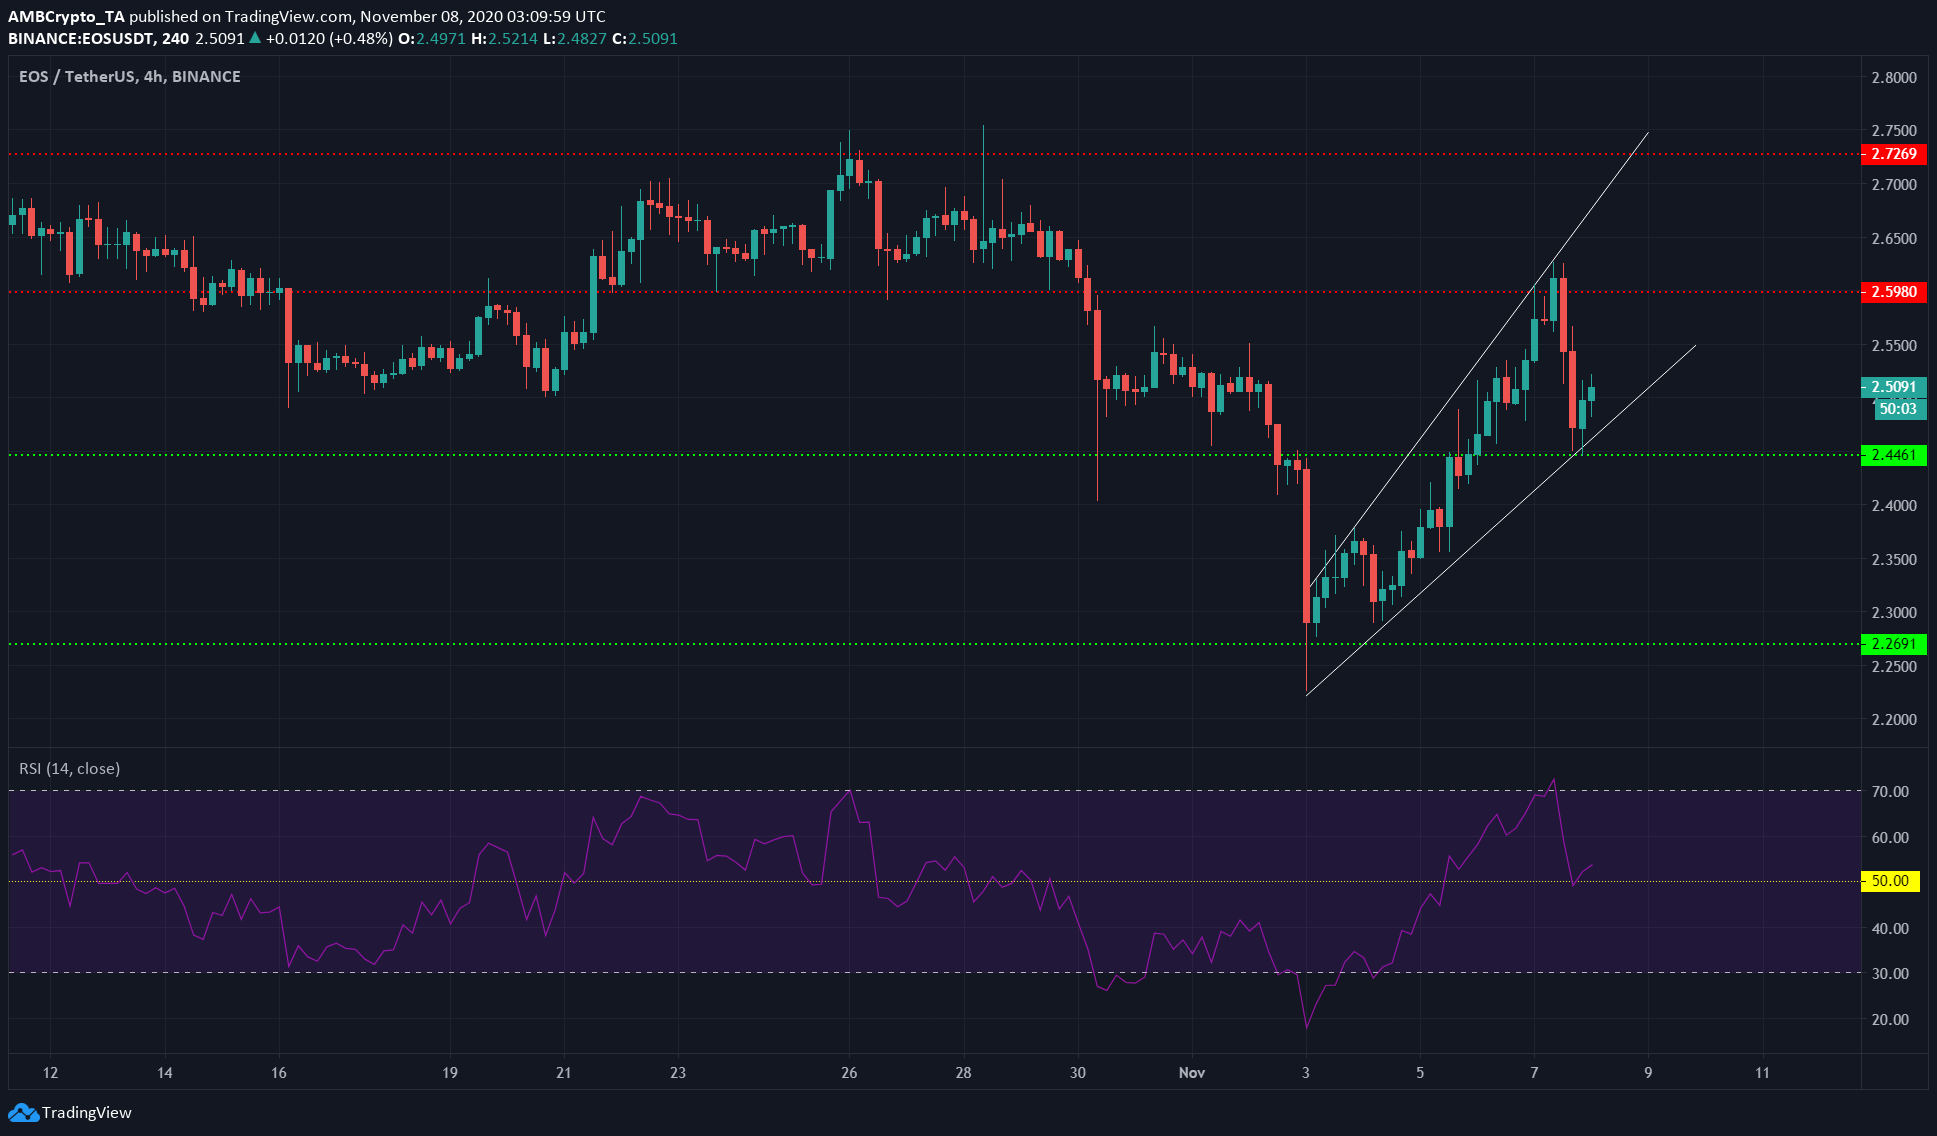
Source: EOS/USDT on TradingView
EOS was in the process of forming an ascending broadening wedge, a pattern that can break out to either side, at the time of writing. A close under the pattern would see EOS take the price to the base of the pattern, that is, towards $2.26.
A breakout to the upside could see EOS rise past $3 in the next few weeks.
The RSI fell from overbought to neutral and bounced off the neutral zone at 50. This suggested that bullish momentum was still prevalent, with the recent drop from $2.6 to $2.46 being a pullback in a strong trend.
NEM [XEM]
Source: XEM/USD on TradingView
The Stochastic RSI showed that XEM had blown off some steam from its most recent pump from the support at $0.095 to a local high at $0.132, in a little over two days.
The MACD noted strong bullish momentum prior to the pullback, and at the time of writing, it threatened to form a bearish crossover.
In conclusion, it was likely that XEM would experience another move upwards, but it might not re-test support at $0.115 over the next few hours due to its bullish momentum. However, Bitcoin and Ethereum’s price could influence XEM.
In other news, NEM recently announced a strategic partnership with Transak Finance, enabling users to buy XEM via bank transfer or debit card.
Zcash [ZEC]
Source: ZEC/USDT on TradingView
The OBV and the price have both registered a series of lower highs since mid-October. This was a worrying sign for ZEC bulls, even though ZEC has posted moderate gains since finding a bottom at $52.
The crypto-asset had not yet reversed its downtrend (white) but had posted some gains (orange). With the support at $56.6 and resistance at $59.45, it appeared that once more the $60-zone would decide ZEC’s next direction.
Finally, the CMF showed that bulls and bears were in equilibrium in the market, with no net capital flows into or out of the market.

