EOS long-term Price Analysis: 12 November

Disclaimer: The findings of the following article attempt to analyze the emerging patterns in the EOS long-term market and its impact on the price
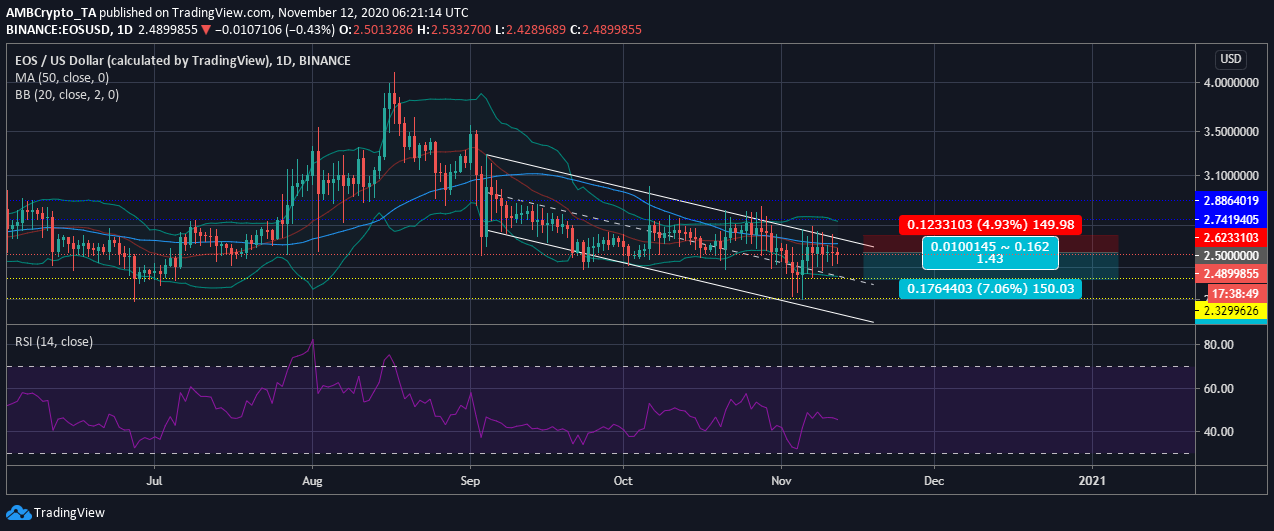
EOS, like some altcoins, has been sinking lower on the charts with every passing day. This, even as Bitcoin and some other major crypto-assets consolidated. However, if one were to view the long-term market, it can be observed that the value of the digital asset has been falling since September, with EOS likely to note more price depreciation soon.
At the time of writing, EOS’s value was facing a lot of selling pressure as it traded at $2.48.
EOS daily chart

Source: EOS/USD on TradingView
The attached chart marked the southbound trajectory in the EOS market, with its bearishness highlighted by the 50 moving average that resorted to staying above the candlesticks. Although a trend reversal could be possible, the remaining signs in the market noted a prominent level of bearishness.
The value of EOS had dipped to the support at $2.20 just before press time, before reverting. For three consecutive days, the crypto’s value tested this support, but bounced back. At the time of writing, the value was shrinking between $2.74 and $2.32. This range could be favorable for a short-position.
Reasoning
The Relative Strength Index bounced back from the oversold zone and, at press time, was at equilibrium. However, the Bollinger Bands were underlining the growing volatility in the market as the bands diverged. Meanwhile, the Signal line had also moved above the price bars, indicating that the price was trending lower.
The price of the digital asset may note a small correction before it looks at a trend reversal.
Positions
Entry: $2.50
Stop-loss: $2.62
Take-profit: $2.32
Risk-to-reward: ~1.43
Conclusion
EOS’s price may continue its southbound journey for now. If the price manages to surpass the price level at $2.74, there could be a reversal in trend. Until then, traders may want to look at short positions to earn that extra something from the EOS market.


