
Bitcoin [BTC] was holding the support level at $11,800 with an eye on a possible breakout over $12,000, at the time of writing. However, BTC’s movement has been relatively recent as, over the last few months, many of the market’s altcoins have noted good rallies, especially when Bitcoin’s own price was relatively stagnant.
At press time, Chainlink showed no sign of losing momentum, while ATOM exhibited a pattern that might repeat this month. On the contrary, IOTA sought to hold the resistance it recently flipped to support.
Chainlink [LINK]
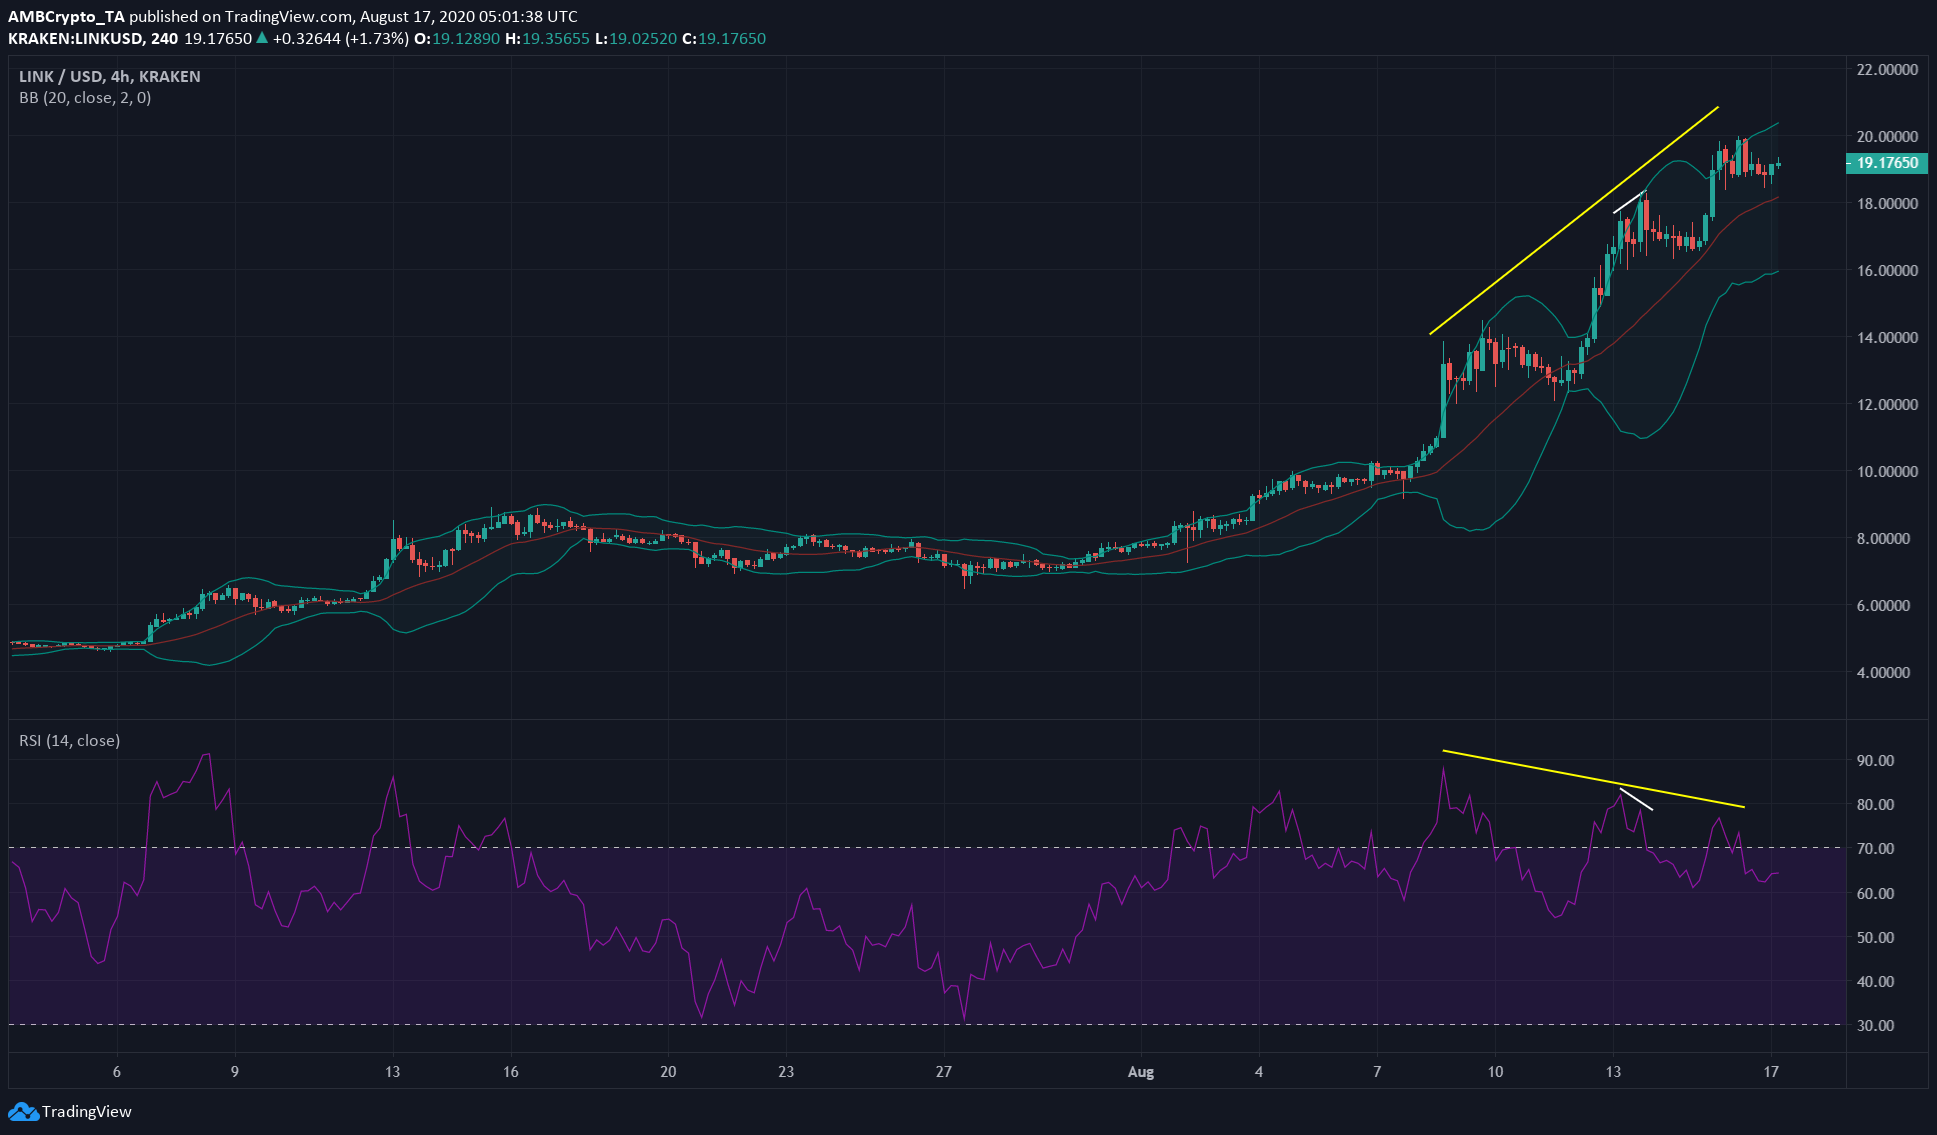
Source: LINK/USD on TradingView
LINK has been one of the market’s strongest performing altcoins over the past few months. Ranked 5th with a market cap of $6.7 billion, LINK was not a crypto-asset one would want to call the top on.
At the time of writing, it was noting classic bearish divergence, wherein the RSI established lower highs while the price formed higher highs. After each divergence, LINK was noting a small pullback, before pushing forward on the charts again.
The RSI had a value of 65, at press time. In fact, the RSI has consistently been above 50, a sign of the continuing uptrend in the LINK market. Finally, the price appeared to revert to the 20-period moving average towards the middle of the Bollinger Bands and the same could climb to the upper band as well
Cosmos [ATOM]
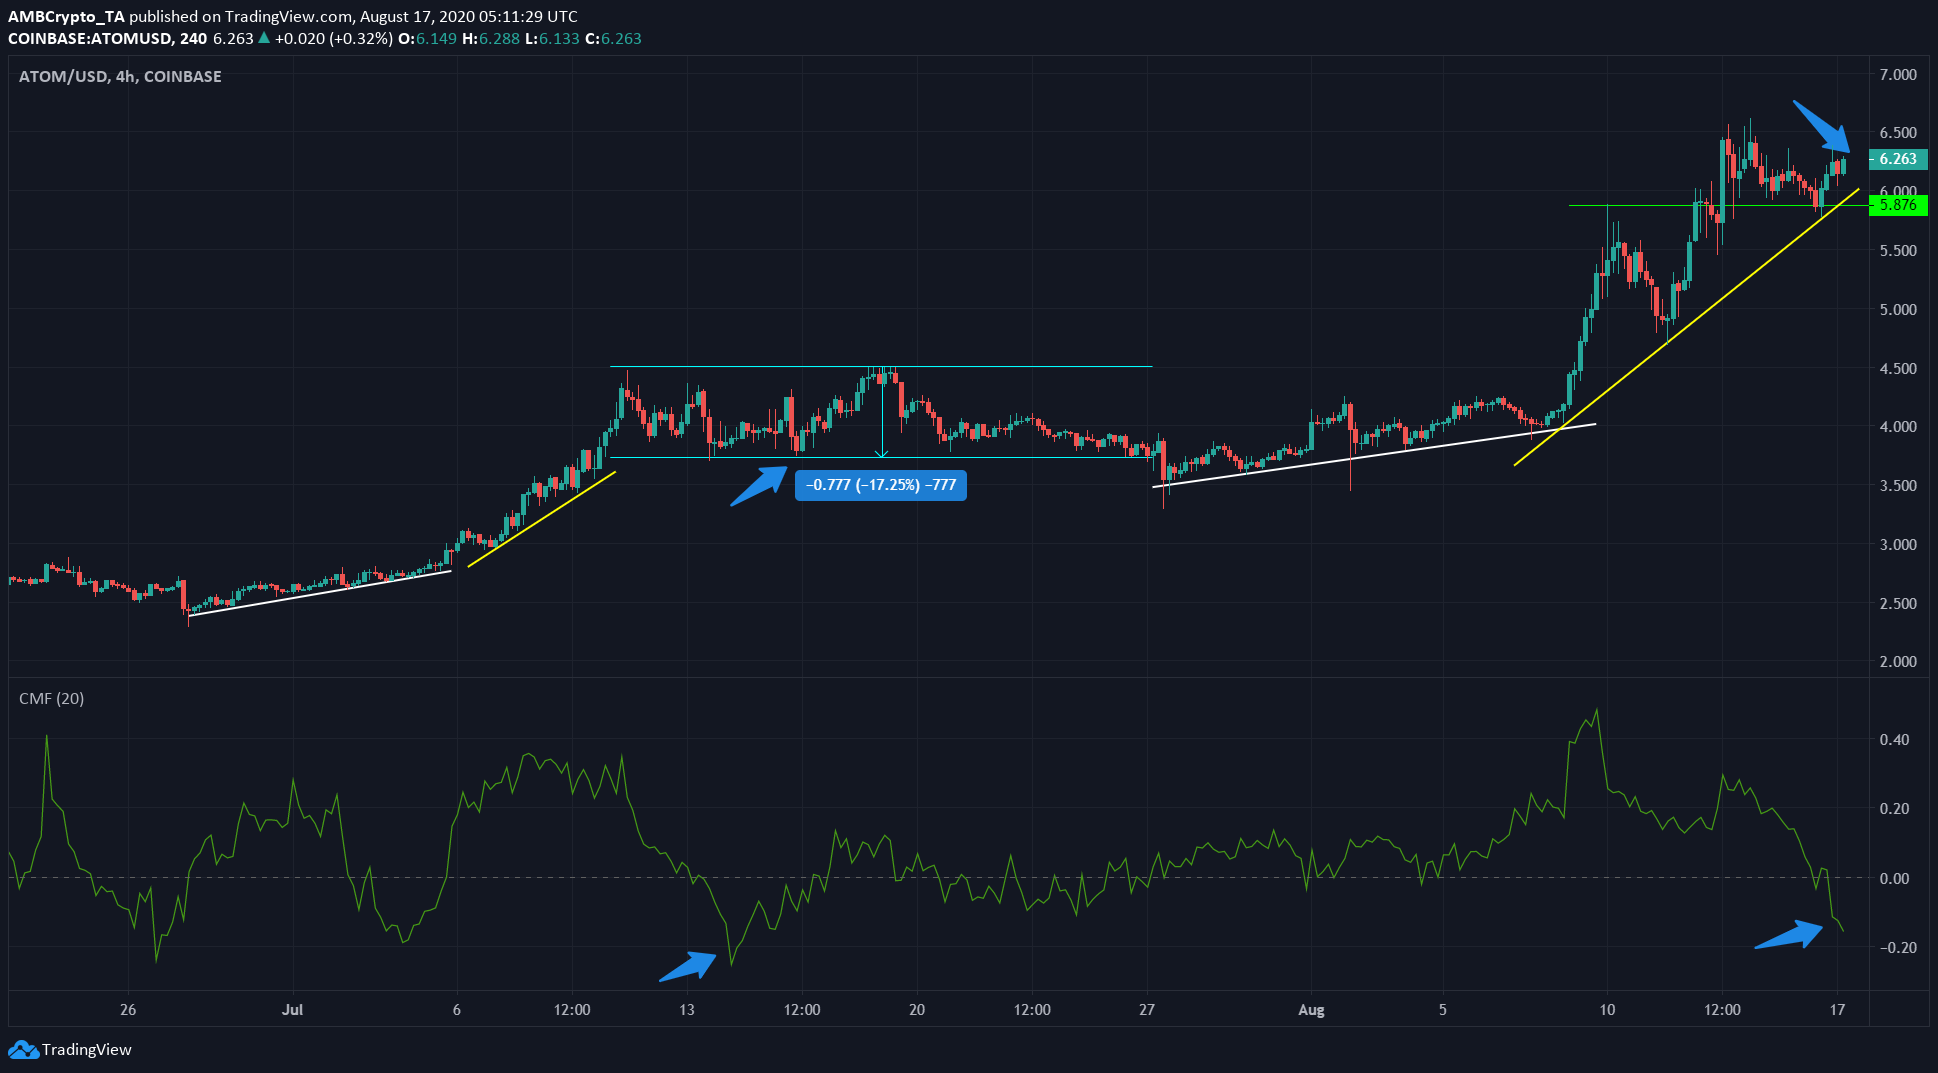
Source: ATOM/USD on TradingView
ATOM was ranked 18th with a market cap of $1.25 billion, at press time. Traders and investors should perhaps be keenly watching the performance of ATOM after it established a crucial support near the $6-level.
The Chaikin Money Flow was below 0 and suggested that money was flowing out of the market. The last time this happened was on 14 July. At that time, the capital outflows had pushed ATOM into a range-bound price action.
In fact, the emergence of a pattern since late-June can be observed, a time when ATOM showed signs of an uptrend (white). This trend later strengthened (yellow) for a while. The next week, the CMF’s values dropped and ATOM was trading near its support level for another week before showing signs of an uptrend on the charts.
Perhaps the pattern would repeat and ATOM would trade near its $5.8 support before picking up steam again. If ATOM loses this support, it might drop as far down as $5.
IOTA
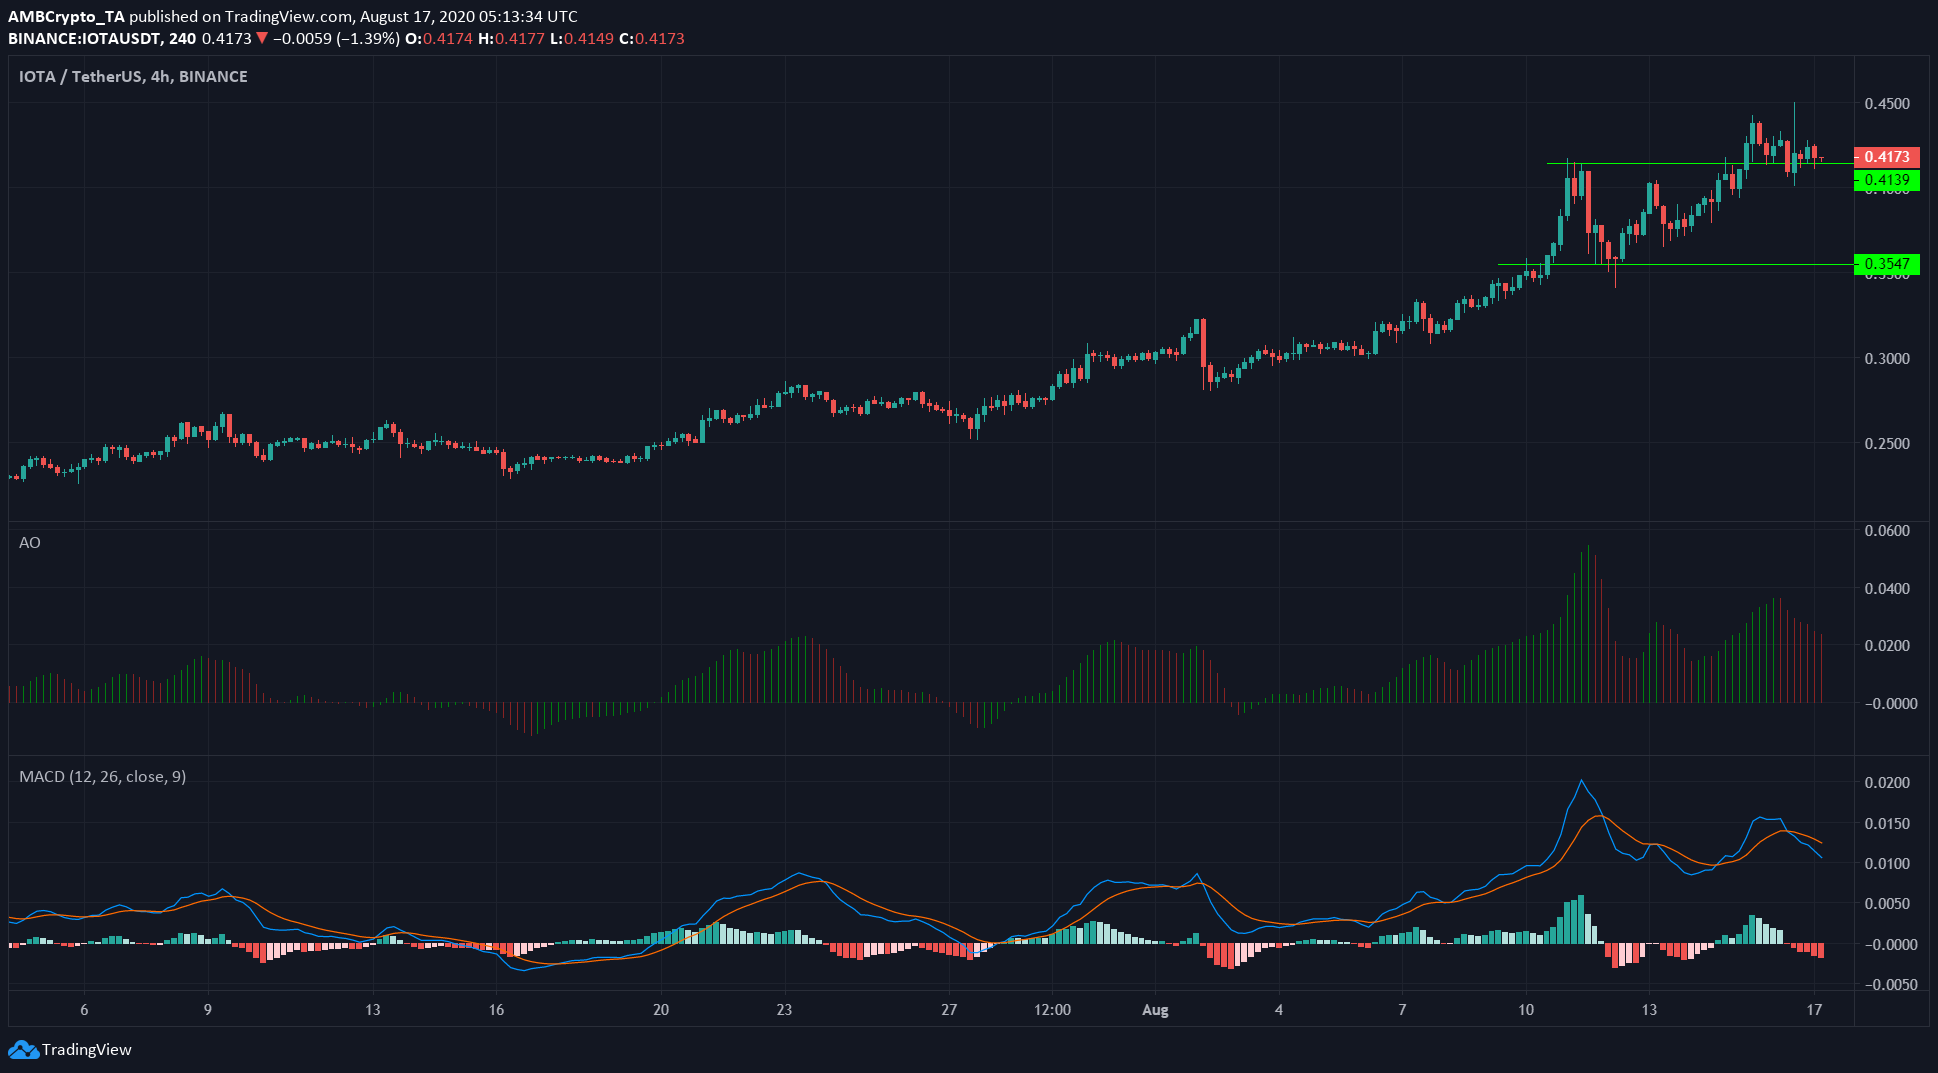
Source: IOTA/USDT on TradingView
IOTA had its support in the $0.413 region, with the next support at $0.35. Further, the Awesome Oscillator showed that the momentum in the IOTA market was waning too, while the MACD registered a bearish crossover.
This could be indicative of consolidation above its support at $0.41. If both the noted supports are lost, IOTA could retrace all its recent gains. This looked unlikely, given its recent strong performances and the overall bullish outlook of the market.
IOTA held the 20th rank on CoinMarketCap as it had a market capitalization of $1.15 billion.