Disclaimer: The findings of the following analysis should not be taken as investment advice and the same should materialize over the next few hours
Bitcoin SV, at the time of writing, was jostling for room and moving under the key price line of $218, a level that has acted as immediate resistance and support multiple times over the past few weeks. With the aforementioned price level acting as immediate support to BSV’s $222 valuation, the token was also accompanied by a market cap of $4.13 billion.
Bitcoin 1-hour chart
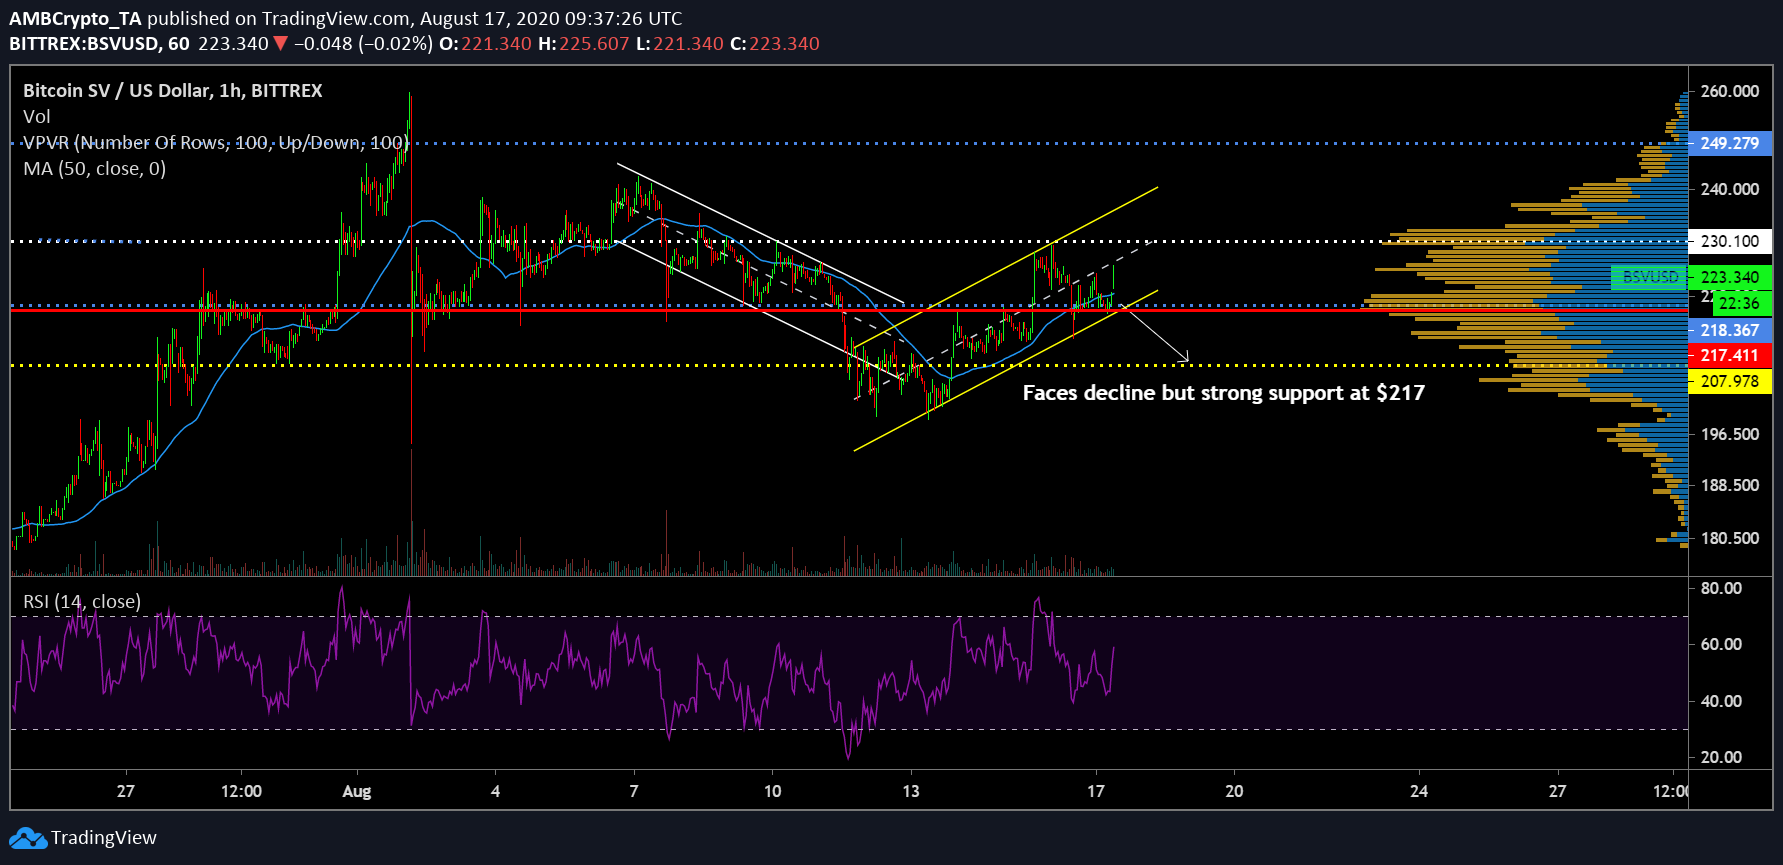
Source: BSV/USD on TradingView
After recording a local high of $249 on 1 August, corrections pulled BSV’s price down to $195 the very next day. However, soon, a recovery was underway, with BSV climbing to $229. Since then, BSV’s valuation has continued to tussle between the range of $230 and $217.
The crypto-asset has been a part of two channels over the past week. The first descending channel was formed between 6 August and 13 August, whereas the press time channel was an ascending one, one that started taking shape after 12 August.
With the price consistently registering higher highs and higher lows, a possible retracement to $217 should take place, but at the time of writing, the support line at $218 was extremely strong. As identified by VPVR, the trading volume at this range has been significant over the past couple of weeks.
With the Relative Strength Index or RSI suggesting an increase in buying pressure as well, there is a possibility that BSV may avoid a tumble below $218 on the charts.
Bitcoin SV 30-minute chart

Source: BSV/USD on Trading View
In spite of the presence of a strong support line, a re-test of $218 is still a likely situation and at press time, a shorting position with a price entry of $222 would incur a risk/reward ratio of 3.6x, if the valuation depreciates to $218. Stop losses should be placed at around $227 since the trend will completely flip if the price notes a hike to reach the aforementioned value.
With the 50-Moving Average acting as the underlying support at $223, the window to short may change towards a long position as well.
Conclusion
Bitcoin SV is likely to re-trace down to $218 on the charts over the next 24-48 hours.