
For all the talk about an incoming altseason, Bitcoin’s movement is the one that catches the imagination of most in the crypto-market. Owing to its market share and the high correlation stats it shares with most altcoins, BTC’s hikes and falls usually determine the direction of the general market movement. The same was evident when the examples of Chainlink, Waves, and Dogecoin were considered.
Chainlink [LINK]
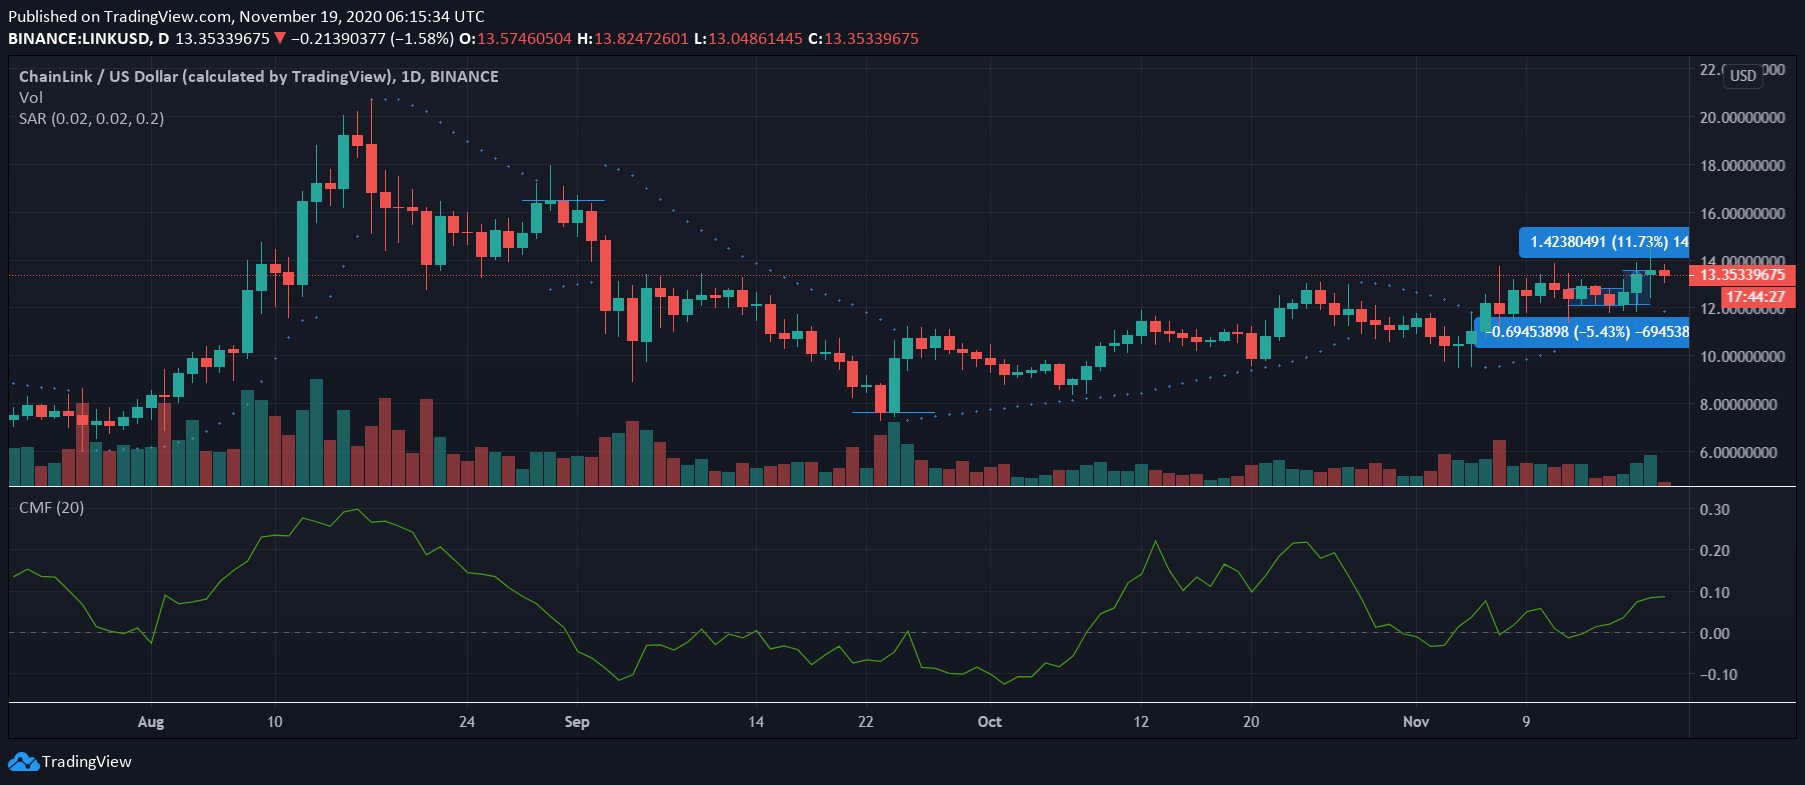
Source: LINK/USD on TradingView
Chainlink, the industry’s 5th largest cryptocurrency, has had a topsy-turvy 2020. While the month of August saw LINK climb exponentially on its way to a new ATH, the months since have seen LINK dip sharply on the charts. In fact, until recently, LINK had been trading within a tight channel, unable to push beyond it and climb towards its previous highs again. The hike in Bitcoin’s price, however, came at a good time as LINK climbed by over 11% in a matter of just days.
This is a fairly interesting observation since, among the market’s top cryptos, LINK has the lowest correlation with the world’s largest cryptocurrency. It should be noted that despite LINK trading at a price level well below its ATH, it was still noting YTD returns of 631%, at press time.
The placement of the Parabolic SAR’s dotted markers gave impetus to the LINK market’s bullish movement while the Chaikin Money Flow was holding steady near 0.10, a sign of capital inflows being stronger than capital outflows.
Chainlink Live was recently integrated by Base Protocol on its mainnet, an integration that followed news of more integrations over the past few weeks.
Waves [WAVES]
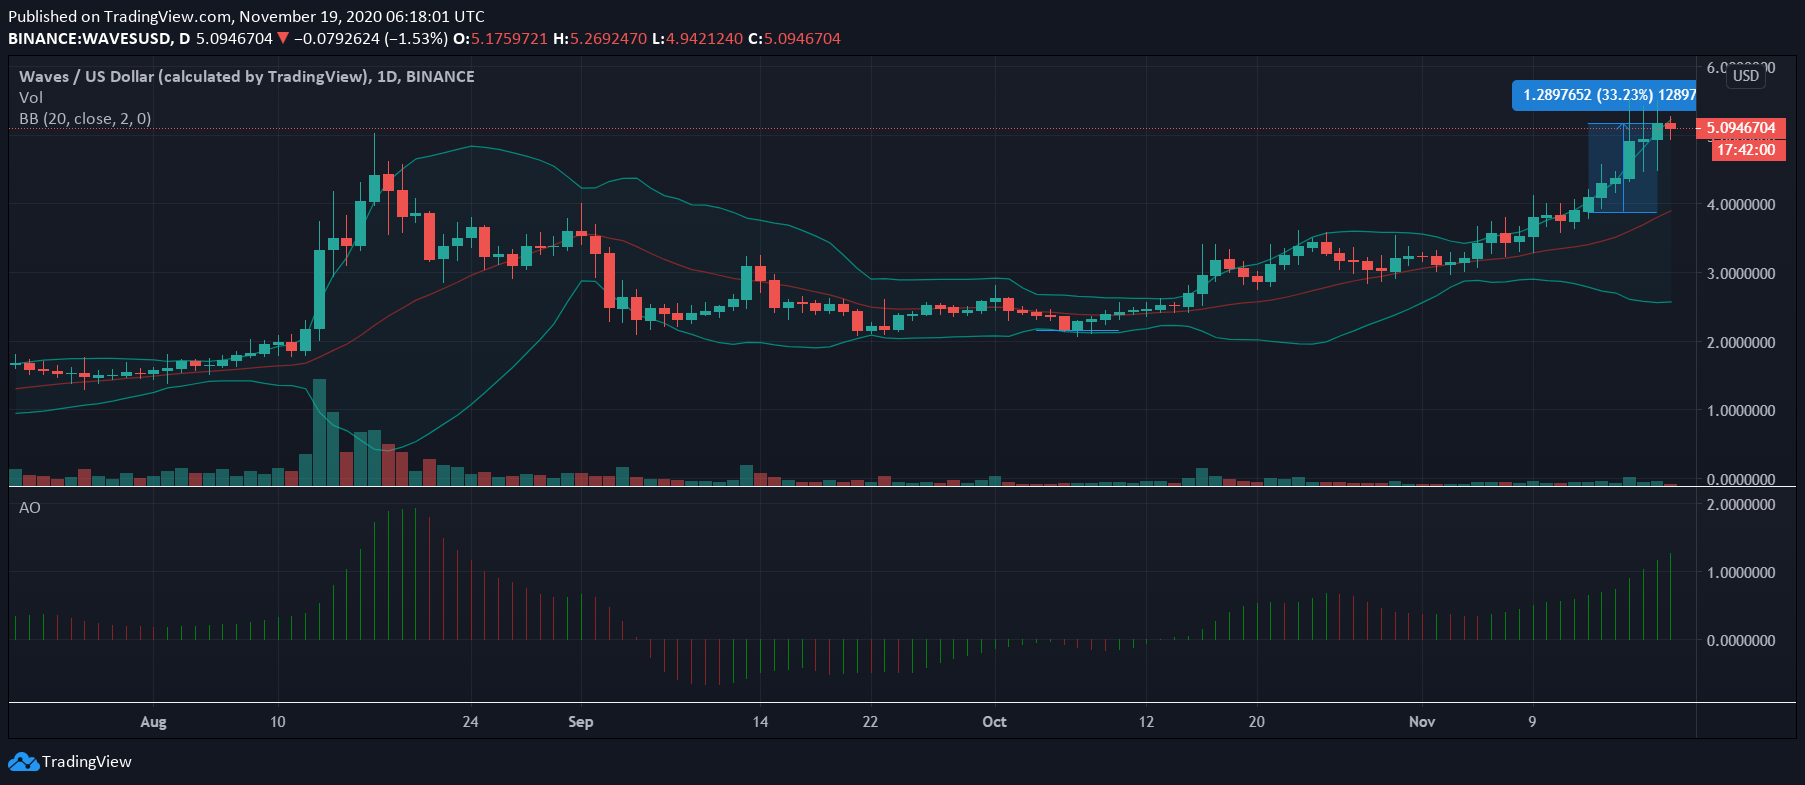
Source: WAVES/USD on TradingView
Waves, the industry’s 37th-ranked cryptocurrency, has been one of the market’s best performers over the past month and a half, with the crypto climbing exponentially since a phase of sideways movement in the month of September. Contrary to most alts in the market, WAVES was already on a hike well before Bitcoin surged, owing to which, its own movement was given even more bullish impetus.
In the past week alone, WAVES has climbed by over 33% on the price charts, despite the fact that at press time, some corrections seemed to be setting in.
However, the crypto’s indicators seemed to suggest that more price movement was incoming as while the Bollinger Bands were well wide, the Awesome Oscillator underlined the spurt in market momentum on the charts.
Dogecoin [DOGE]
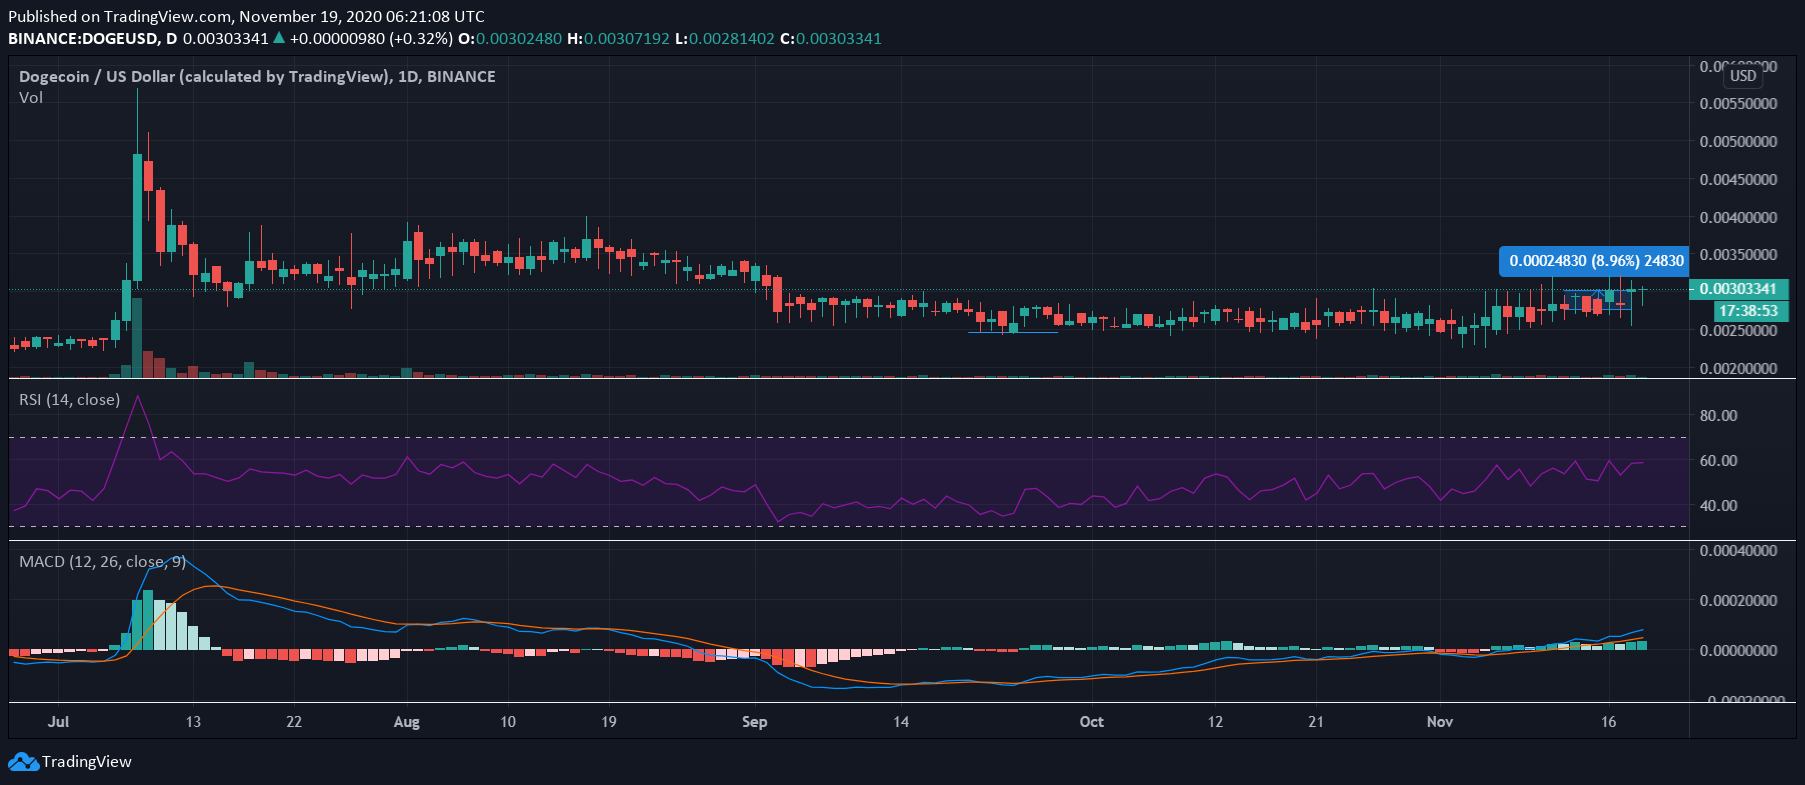
Source: DOGE/USD on TradingView
The crypto-market’s premier meme-coin, Dogecoin hasn’t been in the news since its astonishing 120% price hike over 3 days back in July. Following a correction wave that swept DOGE back to earth, the crypto was trading sideways for most of the last few months. However, of late, DOGE’s price charts did seem to note some bullish movement, and this was especially true over the last week or so.
In fact, DOGE climbed by almost 9% on the charts, a significant improvement in its price performances in the months of September and October.
The same was evidenced by DOGE’s indicators as while the MACD line was climbing over the Signal line following a bullish crossover, the Relative Strength Index was climbing towards the overbought zone on the charts.