Chainlink experienced a minor correction and could be set to surge once more, while The Crypto Fear and Greed Index stood at a neutral value of 53, compared to the previous day’s 56. Bitcoin touched $11,800 and formed a higher low at the $11,400 region. The sentiment did not carry over to Tron, which set a series of lower highs in recent days. Synthetix was in an uptrend but faced a longer-term downtrend and the reaction of the price at trendline resistance could decide the next direction of its market.
Chainlink [LINK]
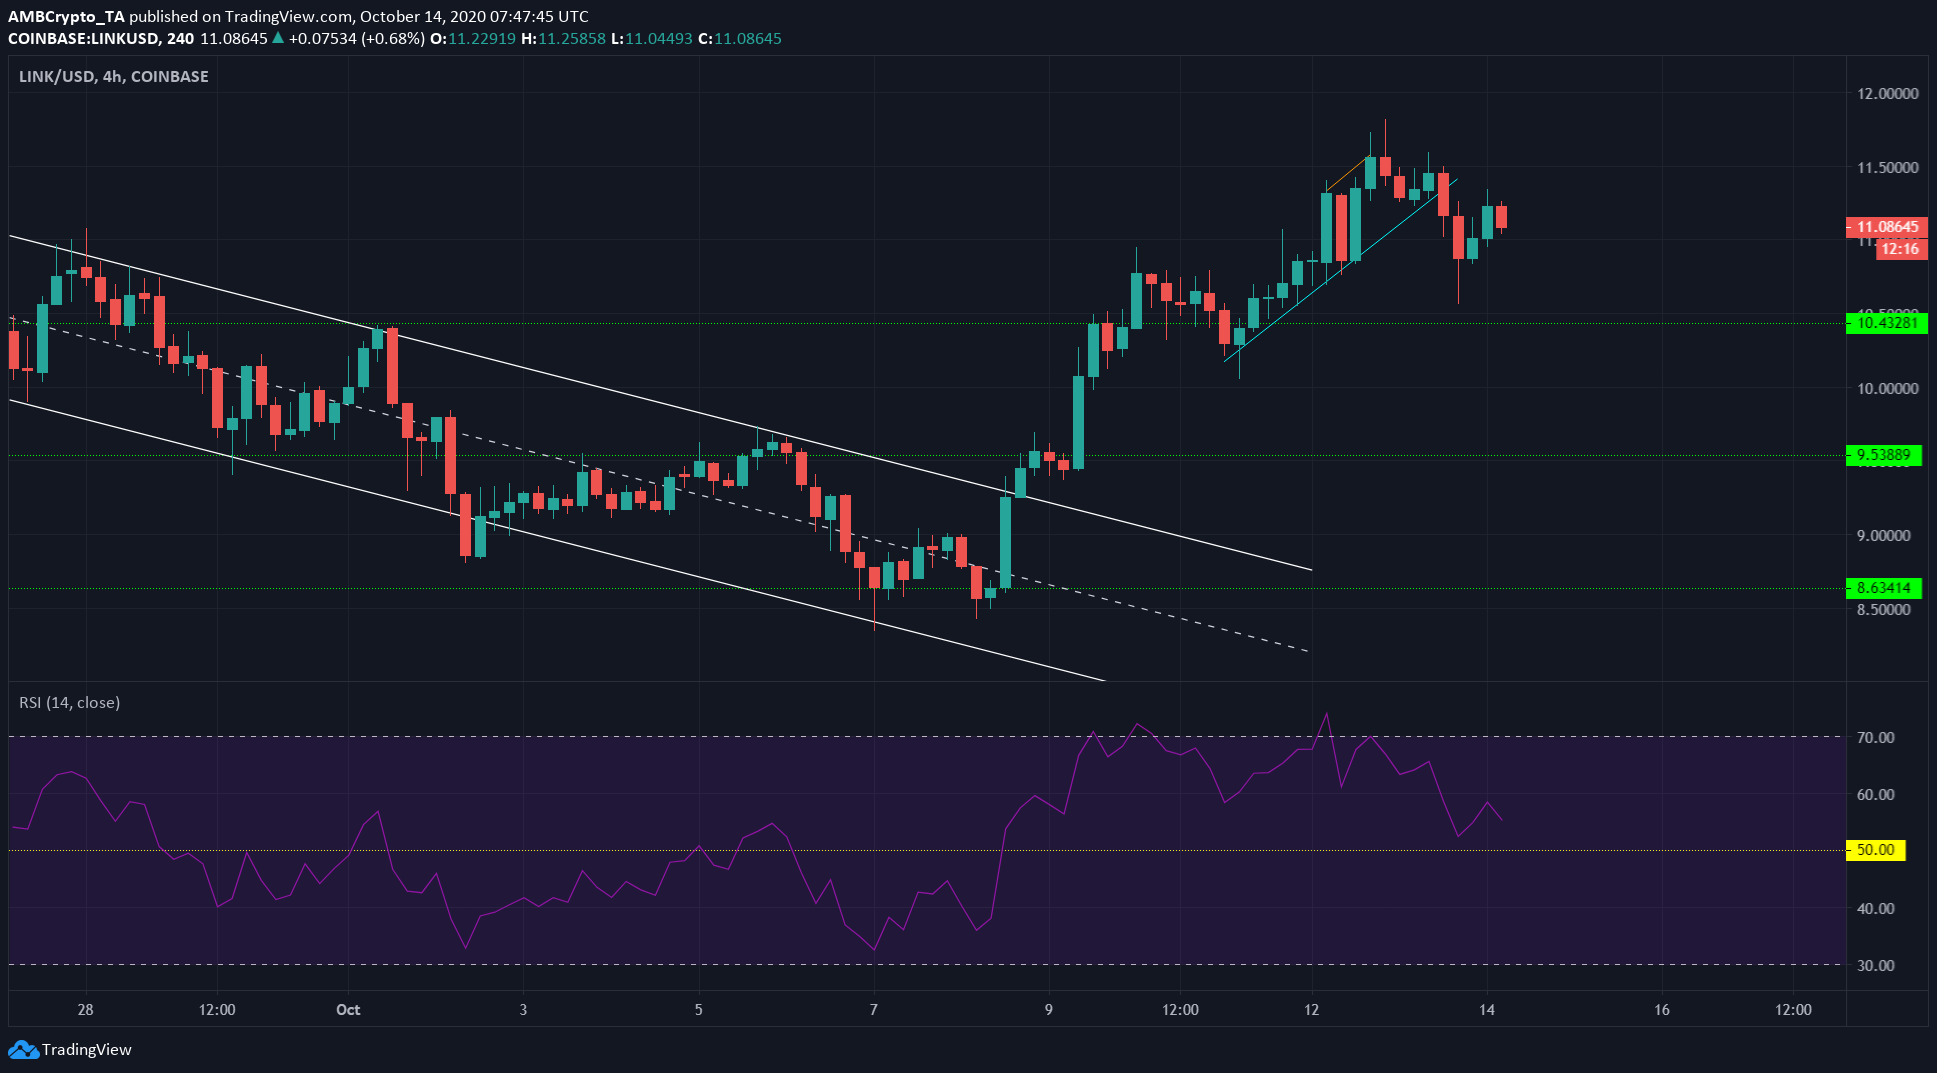
Source: LINK/USD on TradingView
Chainlink showed bearish divergence (orange) after breaking out of the descending channel (white) and reclaiming the $10.5 region. The price set a higher high while the momentum indicator (RSI) made a lower high. The brief uptrend the price was on (cyan) was sharply broken, and LINK found short-term support at $11 and $10.7 beneath it.
RSI continued to stay in bullish territory, but it was setting a series of lower highs alongside the asset.
If LINK dipped beneath $10.7 once more, it could be forced as low as $10.4. However, a defense of $11 in the next few trading sessions would be bullish for the coin.
Synthetix [SNX]
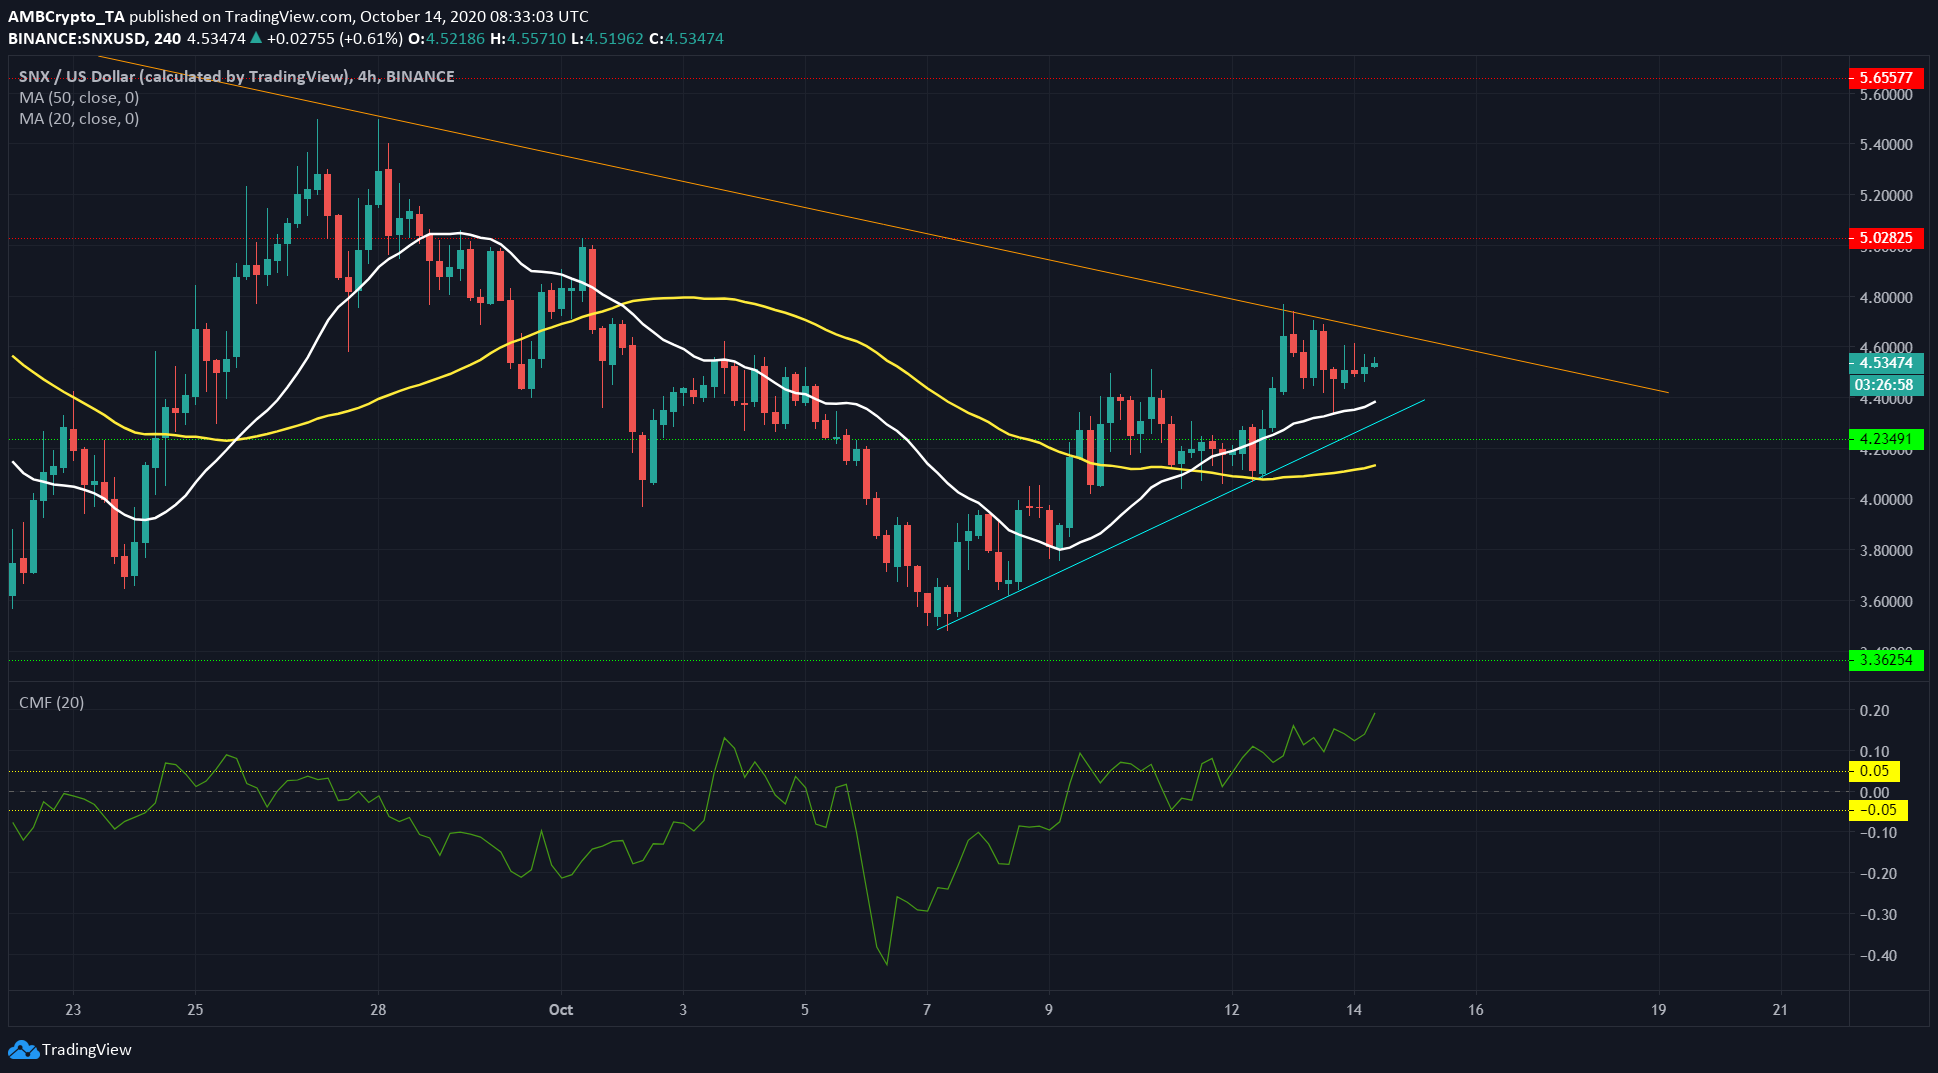
Source: SNX/USD on TradingView
20 SMA moved above the 50 SMA (yellow) indicating the bullish trend of the past few days.
However, it faced resistance from the down trendline (orange) that extended back to mid-September. Generally, the longer-term trend wins, but SNX had strong capital inflows into the market recently.
The renewed buyer interest might be able to sway the market. The reaction of SNX in the next few trading sessions would give a better idea of where the market would be headed for the next week or two.
Tron [TRX]
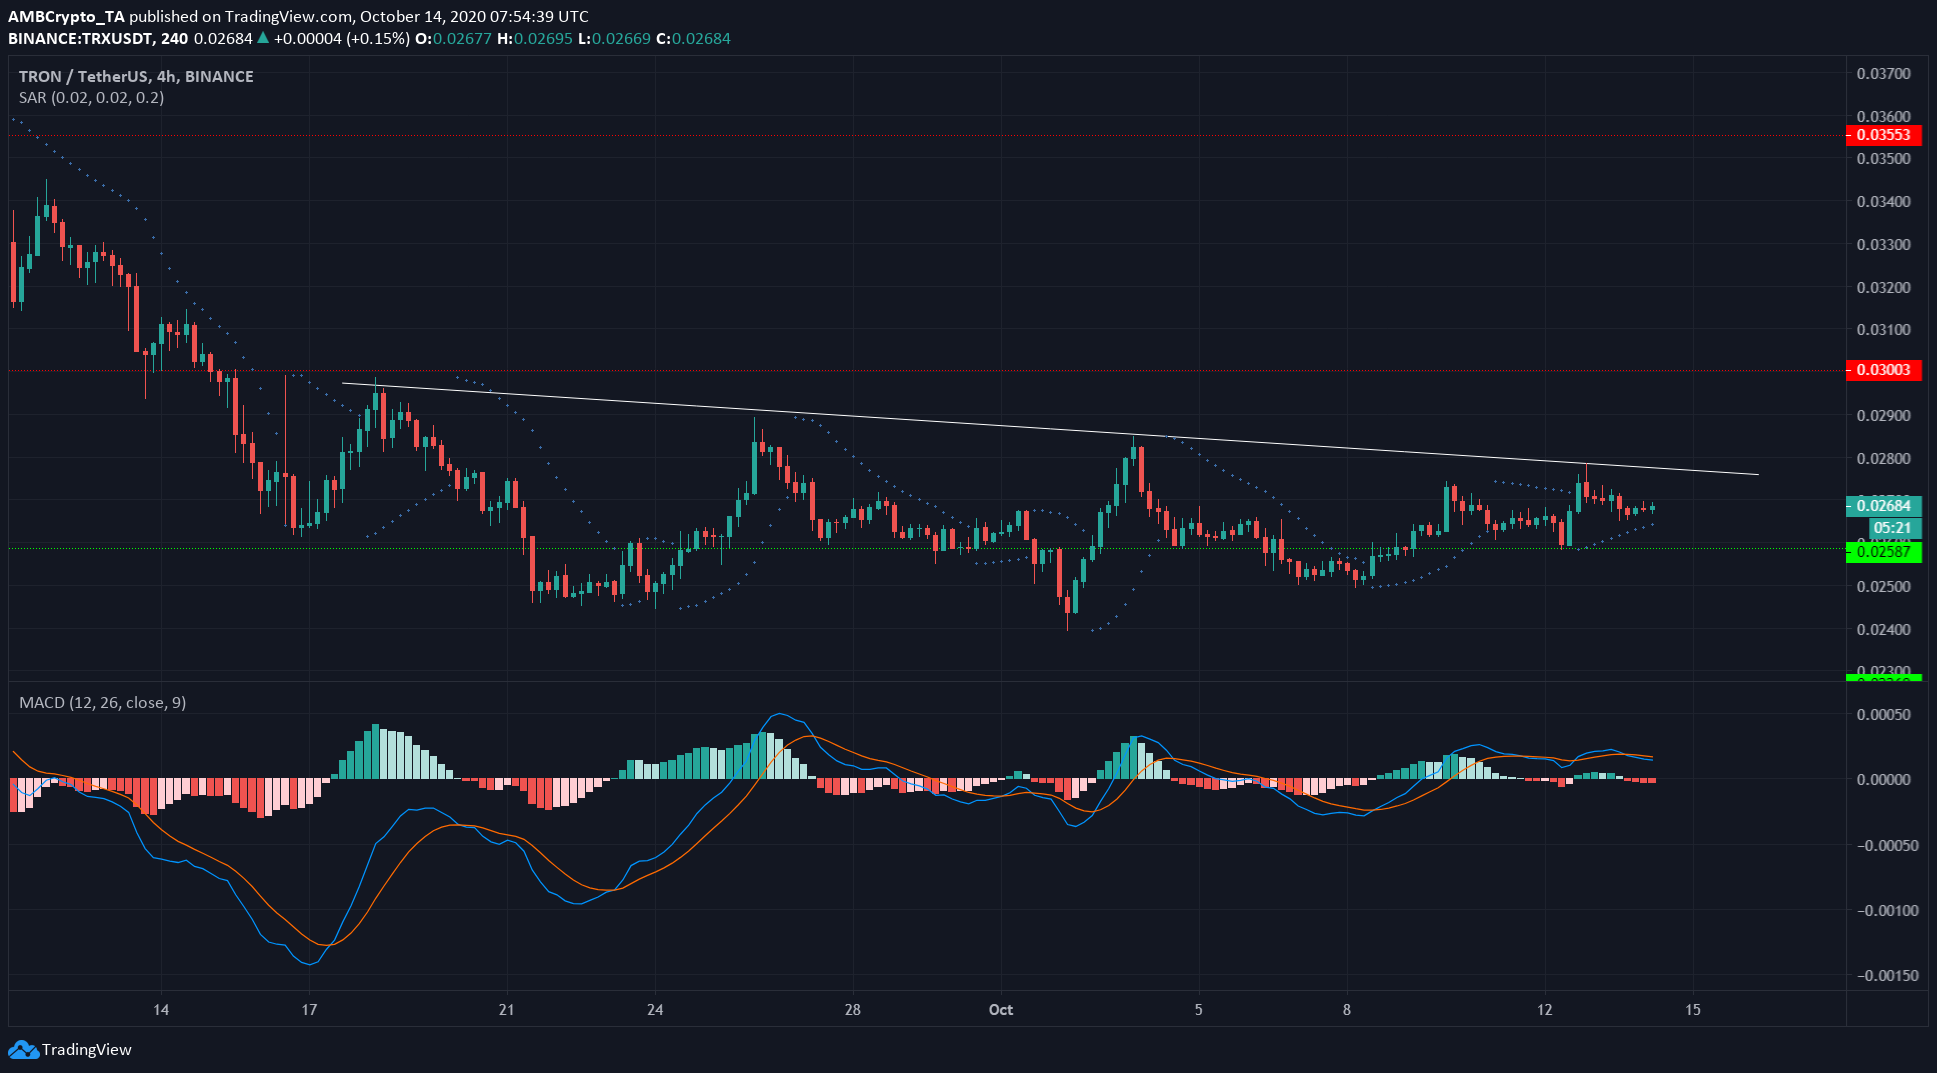
Source: TRX/USDT on TradingView
TRX set a series of lower highs (white), denoting a downtrend. The Parabolic SAR generated a buy signal at press time. The MACD formed a bearish crossover above the zero line – a weak sell signal.
TRX has also set some higher lows in the past few days, suggesting the formation of a symmetrical triangle, a continuation pattern. This suggested that TRX may be in a period of lowered volatility before breaking out to the downside, beneath support at $0.025.