Analysis
Chainlink, STEEM, Enjin Price Analysis: 10 October
Bitcoin surged past the $11,200-level recently, with the world’s largest cryptocurrency trading at $11,409, at press time. BTC’s price performance was good news since it came on the back of the FCA’s ban on the sale of certain crypto-derivatives.
Further down the crypto-ladder, Chainlink rose past an important zone of resistance, while STEEM and Enjin showed good bullish momentum in the near-term.
Chainlink [LINK]

Source: LINK/USD on TradingView
Chainlink closed a trading session with above-average volume past the zone of resistance from $10-$10.5 after breaking out of a descending channel (white). This has been a robust level that LINK’s bulls have tried to reclaim over the past few weeks.
The next zone of major resistance lay at $12.5. A close above $10.5 indicated that it was likely LINK would test $12.5 in the next few days.
However, the OBV suggested that buying volume over the past few days had not noted a higher high, even though the price had. This was underlined by the orange trendline and the cyan arrows.
This disagreement can be explained by the fact that markets were quite oversold a couple of weeks ago, and buyers are just getting back in again. Another conclusion that can be made is that LINK is due for a correction towards $10 in the coming days.
In related news, Chainlink recently offered a $100,000 grant to developers.
Steem [STEEM]
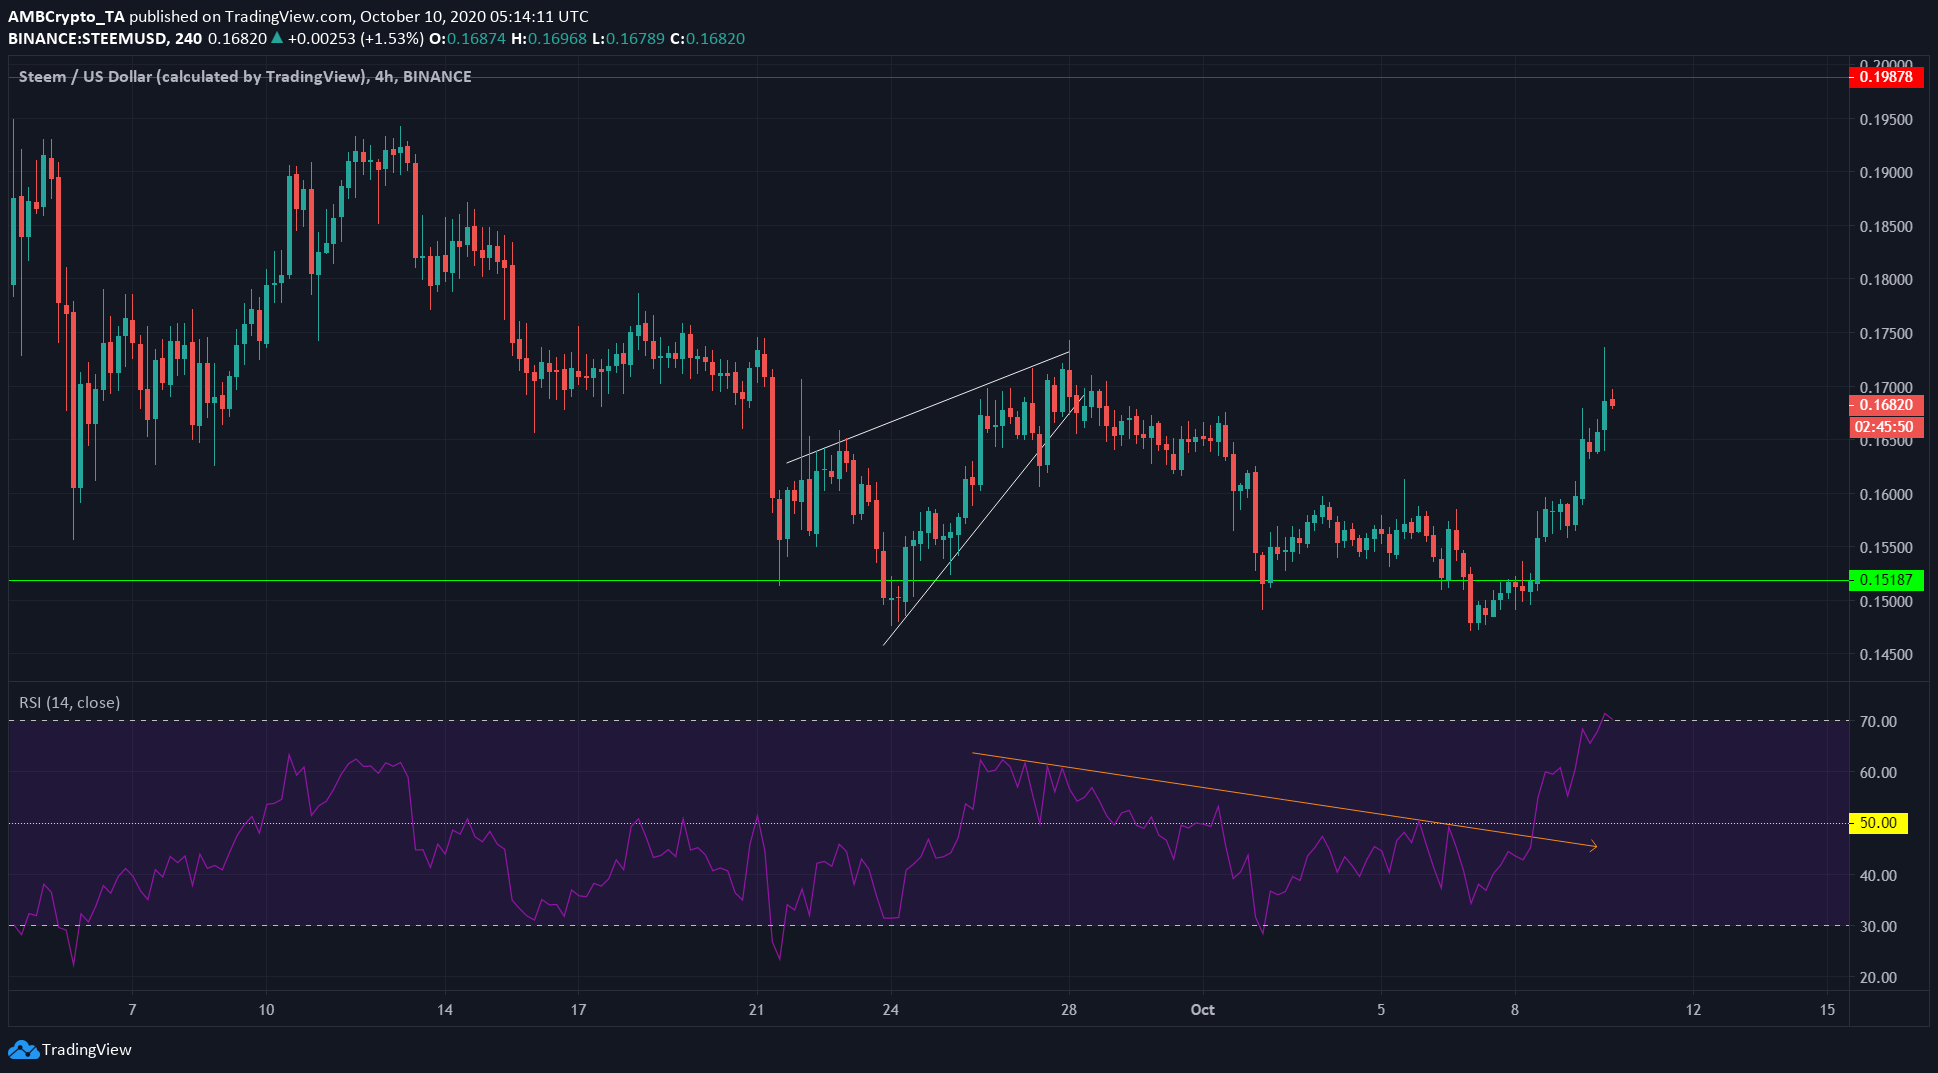
Source: STEEM/USD on TradingView
STEEM formed a rising wedge (white) and dived beneath its support level recently, before recovering remarkably.
On the RSI, a breakout upwards past the falling trendline (orange) and past 50 was observed. This suggested a reversal in the prevailing trend.
Over the next few days, STEEM can be expected to face resistance at $0.171, with another level of resistance at $0.198.
Enjin [ENJ]

Source: ENJ/USDT on TradingView
Enjin had good bullish momentum in the near-term. The 20 SMA (white) was likely to cross above the 50 SMA (yellow), pointing to a bullish trend in the next few days.
Further, the Parabolic SAR generated a buy signal and the rapid rise of the indicator’s dotted markers showed that the price had also risen with strong momentum toward the $0.155 level.
The next level of resistance for the crypto-asset lay at $0.173, with a re-test of the flipped level $0.155 possible in the short-term.