Chainlink long-term Price Analysis: 3 September

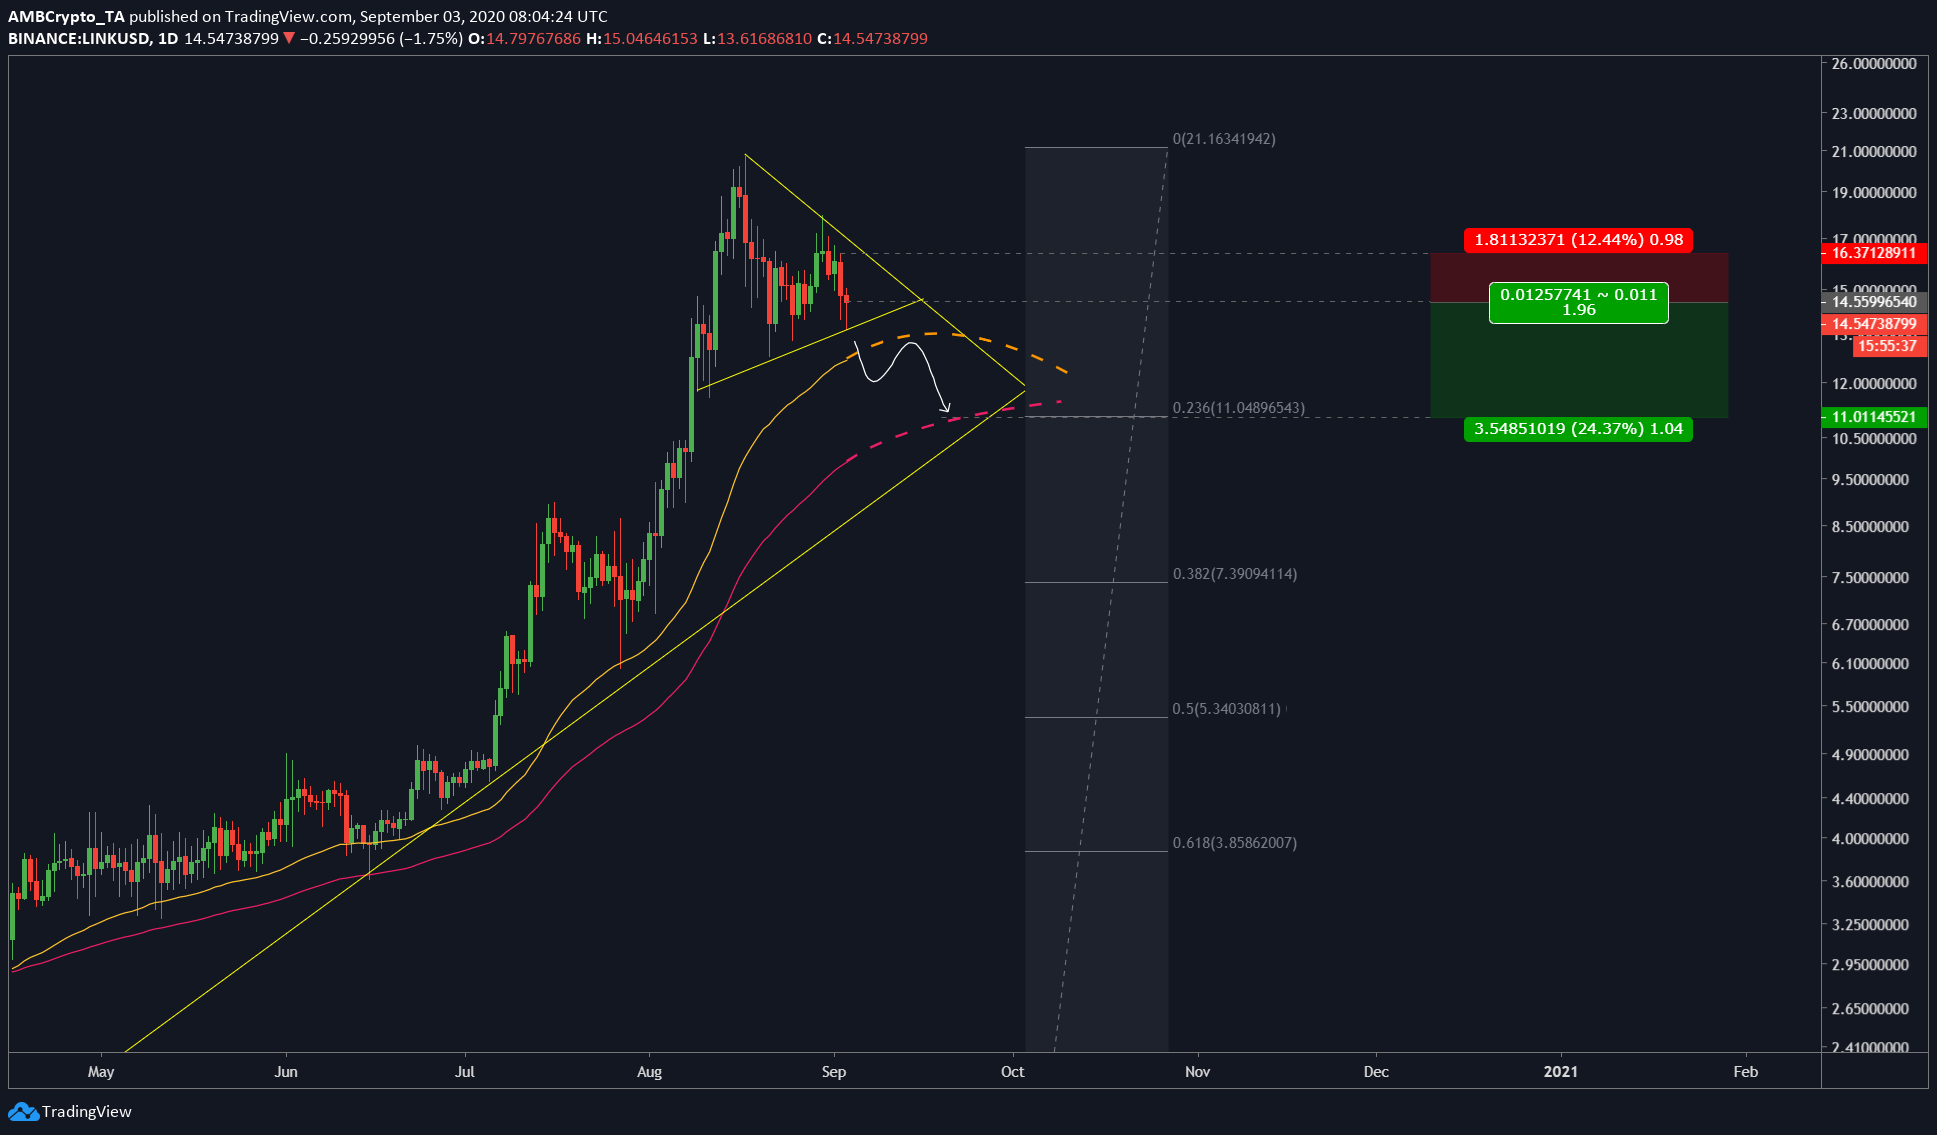
In retrospect, LINK seems to have topped at $21. Since touching the aforementioned price point, LINK has slowly but surely headed down the charts, with the same valued at $14.56, at the time of writing. In fact, Chainlink’s market cap has fallen by ~$500 million in the last 24 hours alone.
At the time of writing, LINK’s price was in a dilemma since the pattern was bullish, but the likelihood of a bullish breakout was low. Hence, we might see LINK go down to $11 if the worst-case scenario pans out.
Chainlink daily chart

Source: LINKUSD on TradingView
The one-day chart for LINK showed that Chainlink had formed a continuation pattern since reaching its ATH on 17 August. Although this pattern is fundamentally bullish and has a higher chance of breaching highs on the charts, it won’t. The reason would be the formation of a bearish divergence, between the price and the RSI. Furthermore, the Stochastic RSI had turned bearish at the oversold zone, a development that means that sellers aren’t done yet.

Source: LINKUSD on TradingView
As for the price, there has already been a re-test at the base of the symmetrical triangle. The Fibonacci retracement tool showed that the price drop wasn’t complete at press time, which is another reason for the price to finish this retracement down to the 23.6 Fib level aka $11.048.
Assuming the price will head lower due to the RSI and the Fib tool, then shorting would be the best option here. The entry for this short position would be at $14.55 with stop-loss at $16.37 aka 12%. The target or take profit level was at $11.048, however, it could be adjusted and placed a little higher at $12.36. For the latter take-profit level, this would mean an R of 1.96.
The price would first drop down to the 50-DMA [orange] and re-test it to only fail and return lower towards the 200-DMA. This would ultimately lead to the price heading towards the mentioned target level at 23.6% fib level.
The RSI’s bearish divergence with the price and the bearish crossover of the Stochastic RSI near the oversold zone further supports this short theory.


