
With the digital asset market stabilizing on the charts to attain some recovery over the past week, Chainlink has been the one to lead this pack of altcoins. Recovering from a local bottom of $9.10, the crypto-asset has done well to briefly re-test the $13-mark over the past 12-hours. However, the appalling bearish pressure continues to be dominant on the charts and despite strong efforts to regain a position above the $13-$15 range, LINK may be looking at another phase of correction over the next few days.
Chainlink 6-hour chart
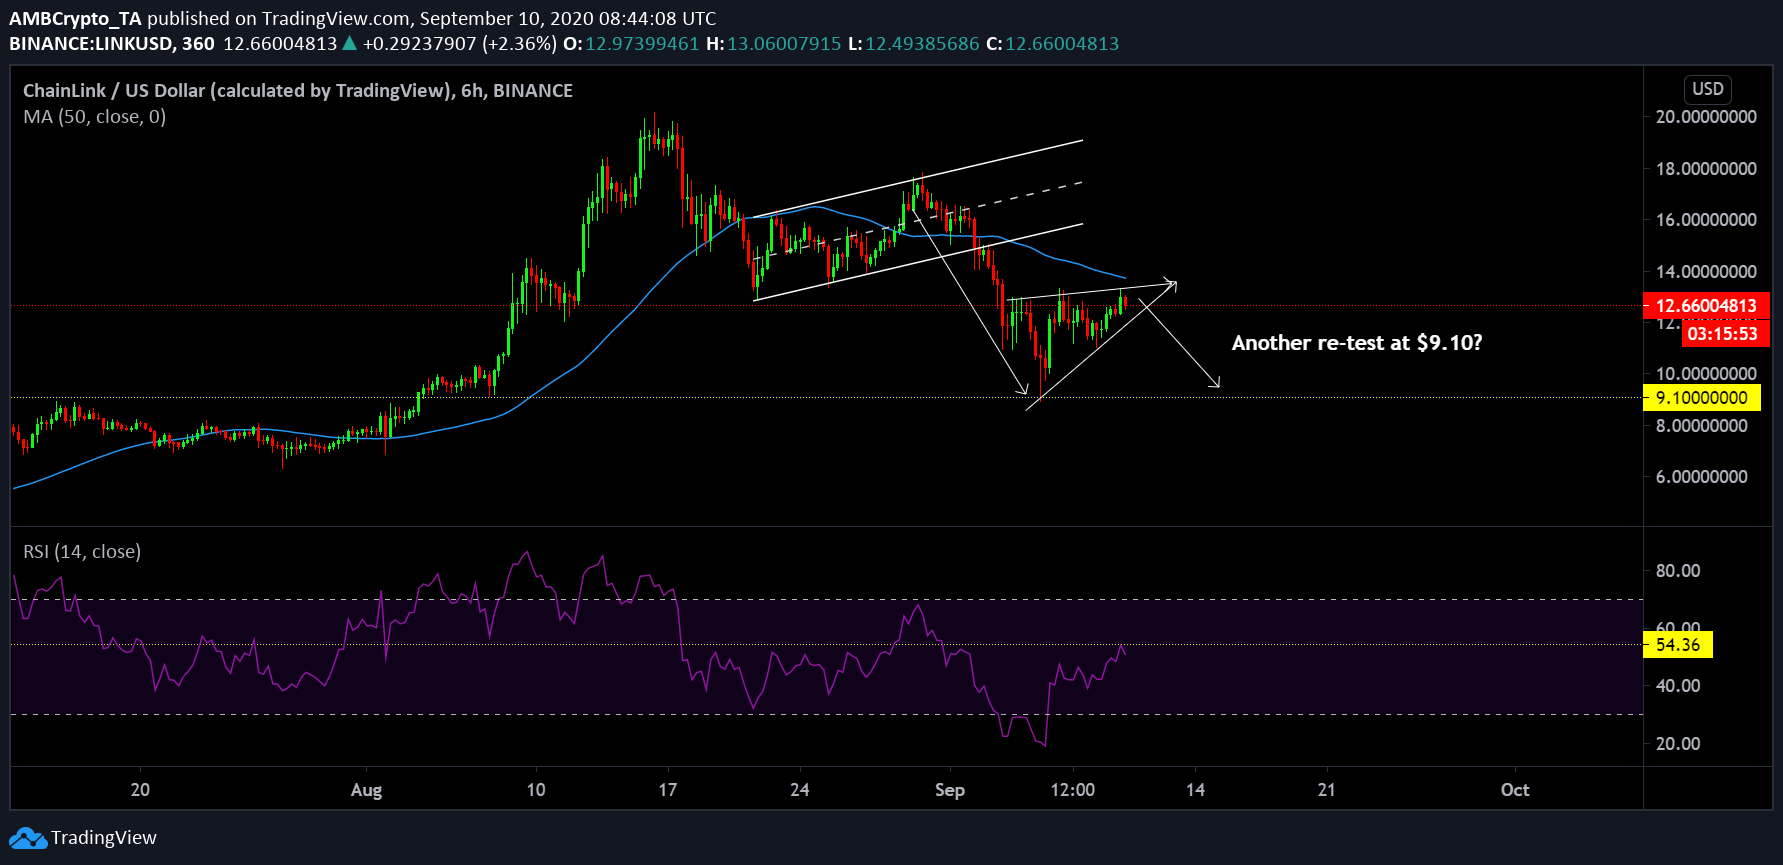
Source: LINK/USD on TradingView
The 6-hour chart for Chainlink suggested that the crypto-asset was looking at a period of correction for a long time, well before the September collapse. It manifested after undergoing an oscillation between the trendlines of an ascending channel and on 2 September, the price broke out of the channel. With the breach in the pattern, the crypto-asset also dived under the 50-Moving Average, a development that was yet another bearish signal for the cryptocurrency.
At the time of writing, with a rising wedge pattern taking shape, there was near certainty that another correction down to $9.10 will be met by the crypto-asset. An immediate bounceback from $10 can also take place, but the bearish sentiment can be flipped as well.
Observing the Relative Strength Index or RSI, the crypto-asset was found to be right under the neutral point, a level over which sellers continued to maintain a strong grip. If buying pressure is able to cross 54 on the RSI, there is a minor chance that LINK might record a breach of the 50-Moving Average, following which, the bearish trend can be reversed.
Chainlink 1-day chart
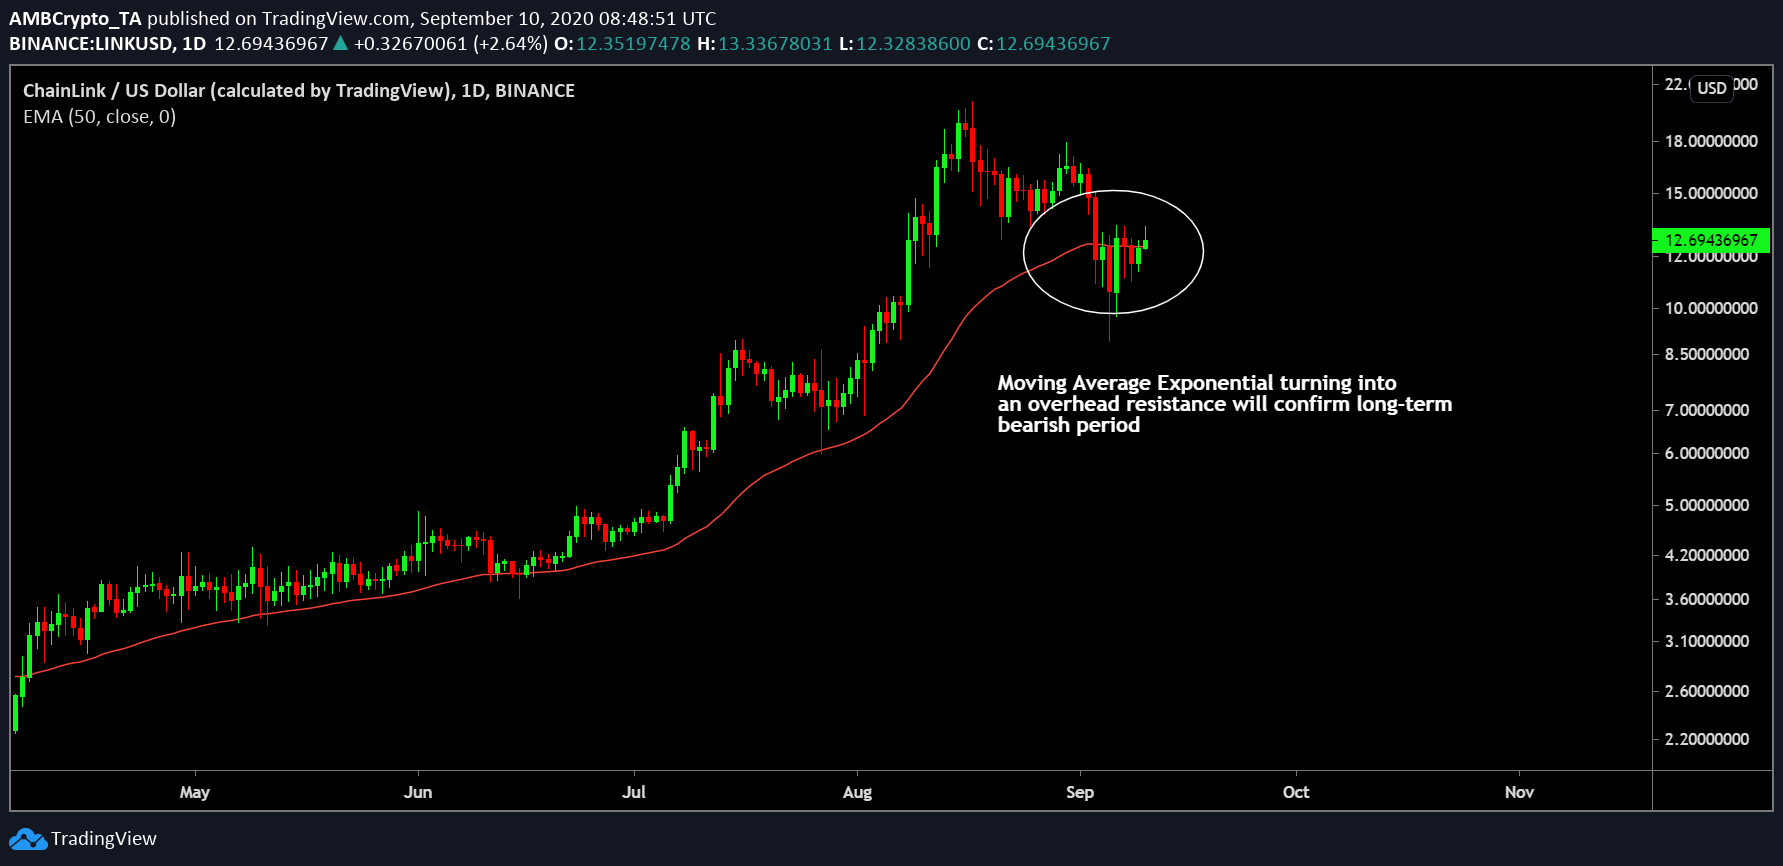
Source: LINK/USD on Trading View
The 1-day chart for Chainlink faced the same dilemma in terms of reversing the bearish pattern. As pictured, the token was maintaining a position above the 50-Moving Exponential for a long time, until recently, when the valuation tumbled below $10.
At press time, the crypto-asset was trying to close a position above the 50-EMA, despite the same having not been completely successful. In the event of a period where the price remains under the 50-EMA for 48-72 hours, the bear trend will be all but confirmed and new lows will be witnessed over the coming weeks.
Hence, a position above the 50-EMA is essential if the crypto wants to sustain its long-term bull run.