
The rally is on and the crypto community awaits most altcoins to join the rally with Bitcoin. Currently, most alts have been lagging and witnessing bearish sentiment. However, given the correlation with the largest asset, the alt season may not be far away.
Some alts have already started to realign themselves for a bullish turn of events, while others have to escape short-term pressure.
Chainlink [LINK]
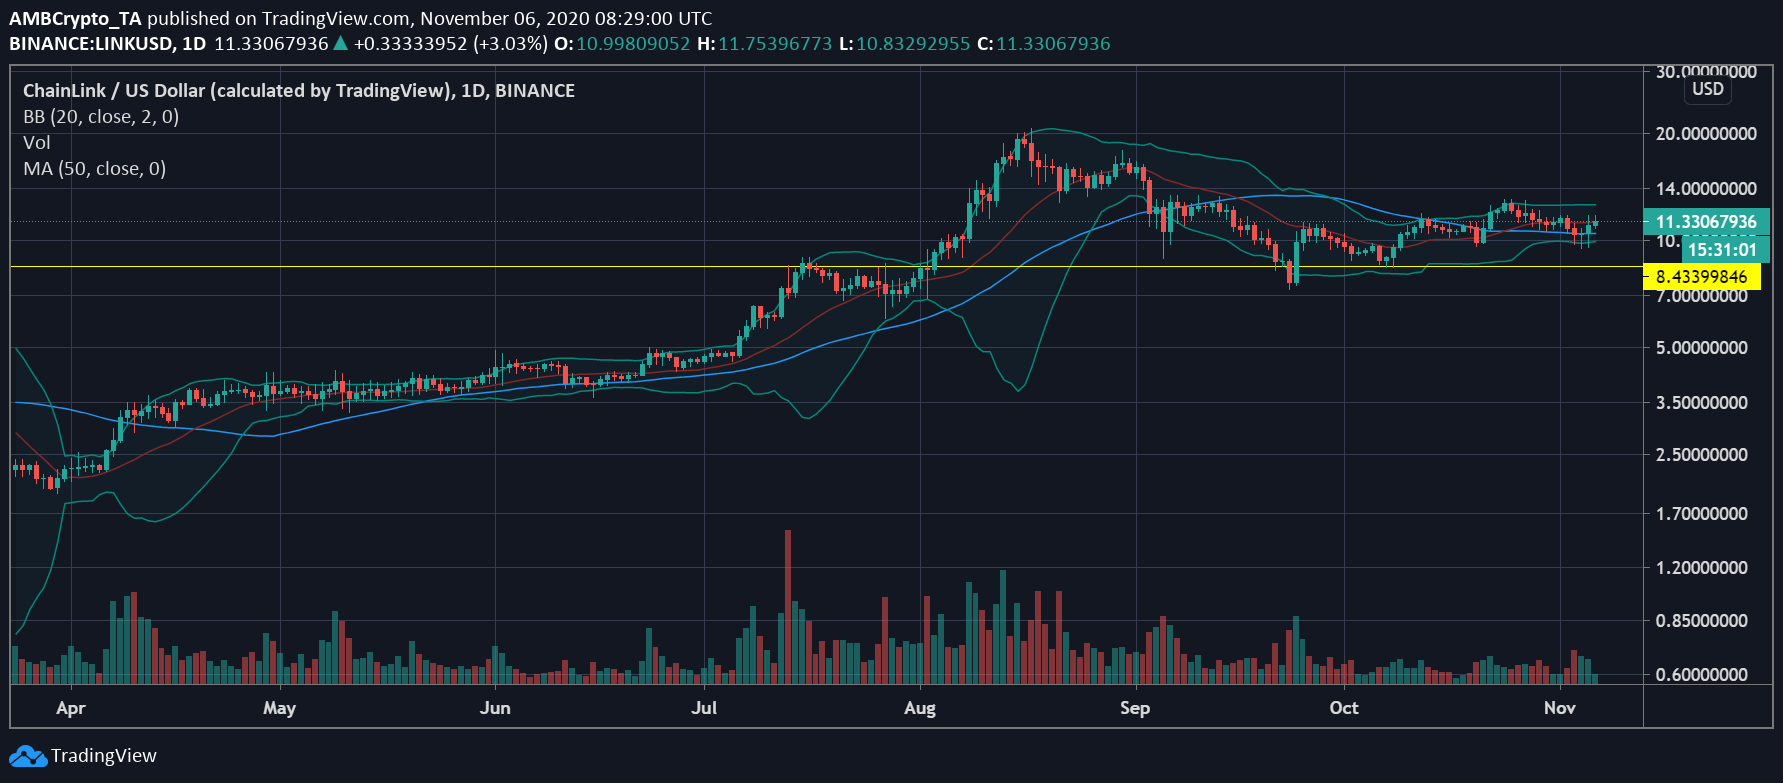
Source: LINK/USD on TradingView
The price of Chainlink has been moving like a wave and currently was being traded at $11.28. If we look at the above chart, the price has recently been moving higher, which has resulted in the 50 moving average to slip under the candlesticks.
The changing trend was also highlighted by the signal line which was noting the rising price of LINK. The Bollinger Bands appeared to be closer than before, indicating reducing volatility in the market. If the current price receives more support from the traders, LINK might be able to jump on the growth train.
Ethereum Classic [ETC]
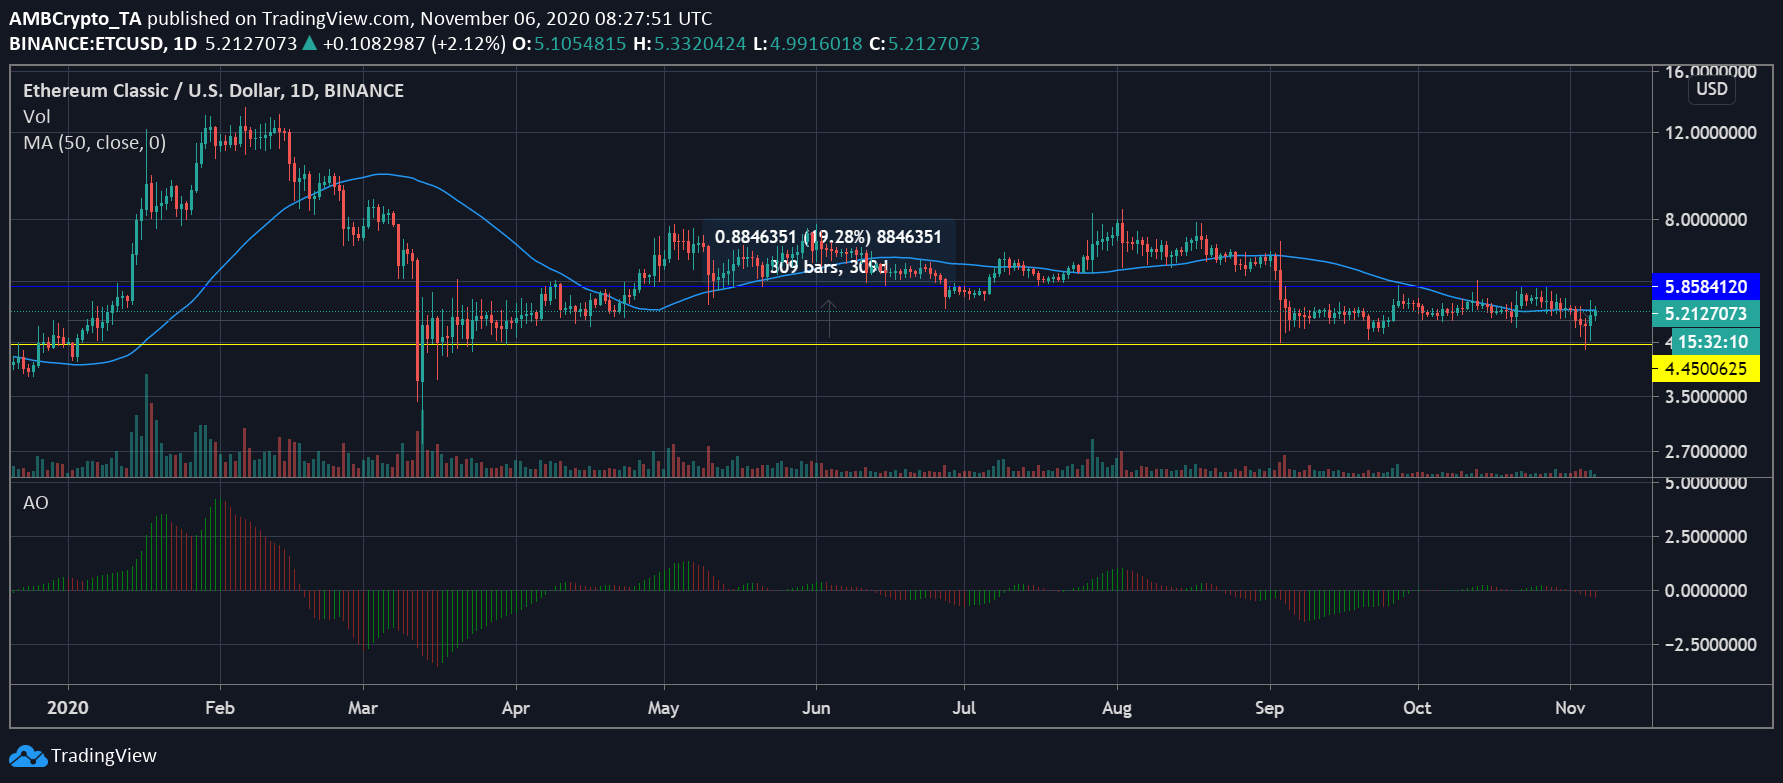
Source: ETC/USD on TradingView
The above chart noted the strong resistance at $5.85 and ETC’s failure in surpassing this level. After re-testing this level recently, the digital asset dropped to the support at $4.45. However, after surpassing the support for a brief moment, it noted a minimal rise in price and was valued at $5.19, at press time.
The Awesome Oscillator indicator noted a negative momentum in the ETC market. It meant that the selling pressure was still higher in the short term, making the dominant trend a bearish one. The 50 moving average has also crossed over the candlesticks, which also meant the price was trending lower.
Dogecoin [DOGE]
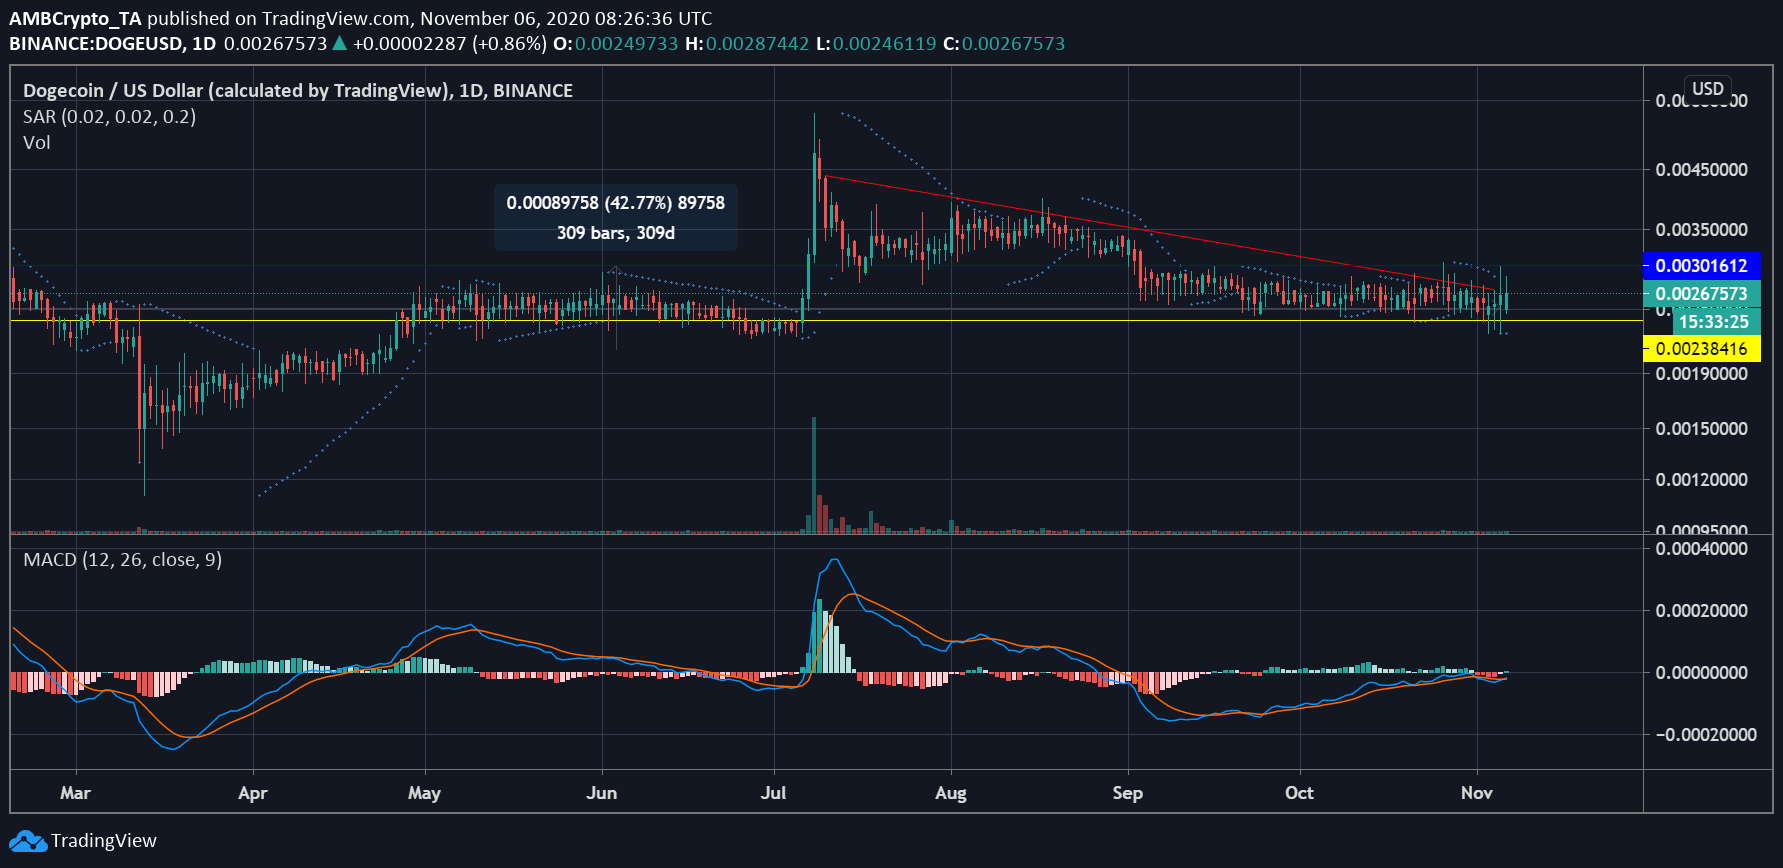
Source: DOGE/USD on TradingView
The meme coin gained a lot of attention due to massive transactions being carried out in June, but ever since has been on a downward slope. The asset’s price has not been supported by enough volume and has recently been consolidating between $0.0030 and $0.0023. Even though DOGE tried to surpass the resistance formed at $0.0030 yesterday, but failed. Its current value remained at $0.0026.
The Parabolic SAR indicator aligned under the candlesticks noting the emerging bullishness in the market. Similarly, the MACD indicator also noted a changing trend. The MACD line overtook the signal line, as the buying pressure for DOGE increases. The MACD had been noting a long bullish trend, but not supported by enough volume. However, the current market is also noting a rise in volume.