Analysis
Cardano’s price could face resistance at $0.039 despite falling wedge pattern

Following a brief recovery, Cardano headed for a downtrend as the month dawned. Despite significant developments on the tech front to bolster the coin’s adoption, Cardano has failed to post any significant gains. Its price slipped by 3.68% over the last 24 hours, according to data on CoinMarketCap. Additionally, ADA was priced at $0.037 and registered a market cap of $981 million, at press time.
ADA 4-hour Chart

Source: ADA/USD on TradingView
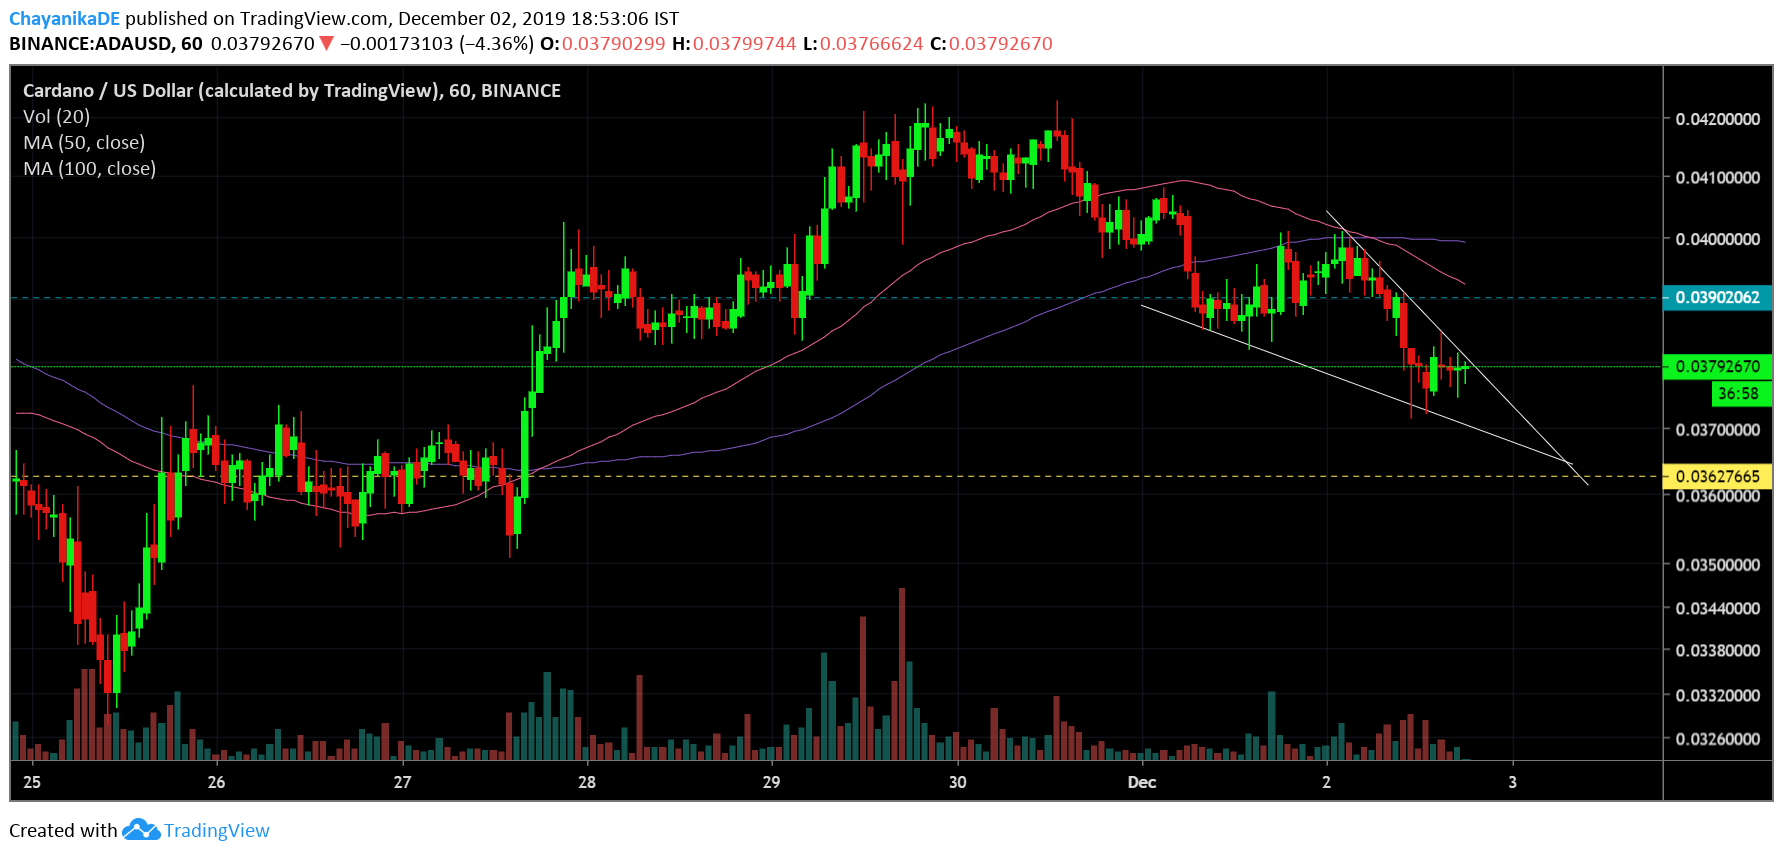
Cardano’s 4-hour chart depicted the formation of a falling wedge pattern with the price oscillating between two downward sloping trendlines. This indicated a potential bullish breakout in the near-term. The decline in ADA’s volume in the same stretch of time further provided validity to the falling wedge pattern.
The moving averages, however, depicted a different picture. In the early hours of 2 December, the moving averages sustained a bearish crossover. Following the same, the 100 moving average was above the 50 moving average and suggested a bearish phase for the coin in the near term.
This could possibly indicate that despite the bullish breakout, the coin could find major resistance at $0.039 and a further breach might be stalled, as indicated by the bearish moving averages. ADA found its strong support at $0.036, a level untested since 27 November.
Bearish indicators
Source: ADA/USD on TradingView
The MACD hovered below the signal line, further predicting a downtrend for the coin’s price in the near-term. The RSI was also below the 50 median. This was indicative of high selling pressure among ADA traders who might re-enter the market in a low price range.
Conclusion
If the trend persists and Cardano’s price manages to break-out to the positive side, the bulls could potentially climb and hit the $0.039-level. However, the bulls might face severe resistance at the point and a further breach might not materialize.

