Cardano, ZBT, KNC’s price performance highlights investor confidence

The prices of many altcoins dropped significantly post the market crash on 12 March. However, many are still optimistic that the coins will put up a good show through the course of 2020. Cardano’s Charles Hoskinson, for instance, is of the opinion that Cardano will outperform Bitcoin, Ethereum, XRP and every other blockchain in the industry by the end of 2020.
Cardano

Source: Cardano/USD, TradingView
There might be a lot of positive sentiment around Cardano, but one look at the coin’s price chart might suggest otherwise.
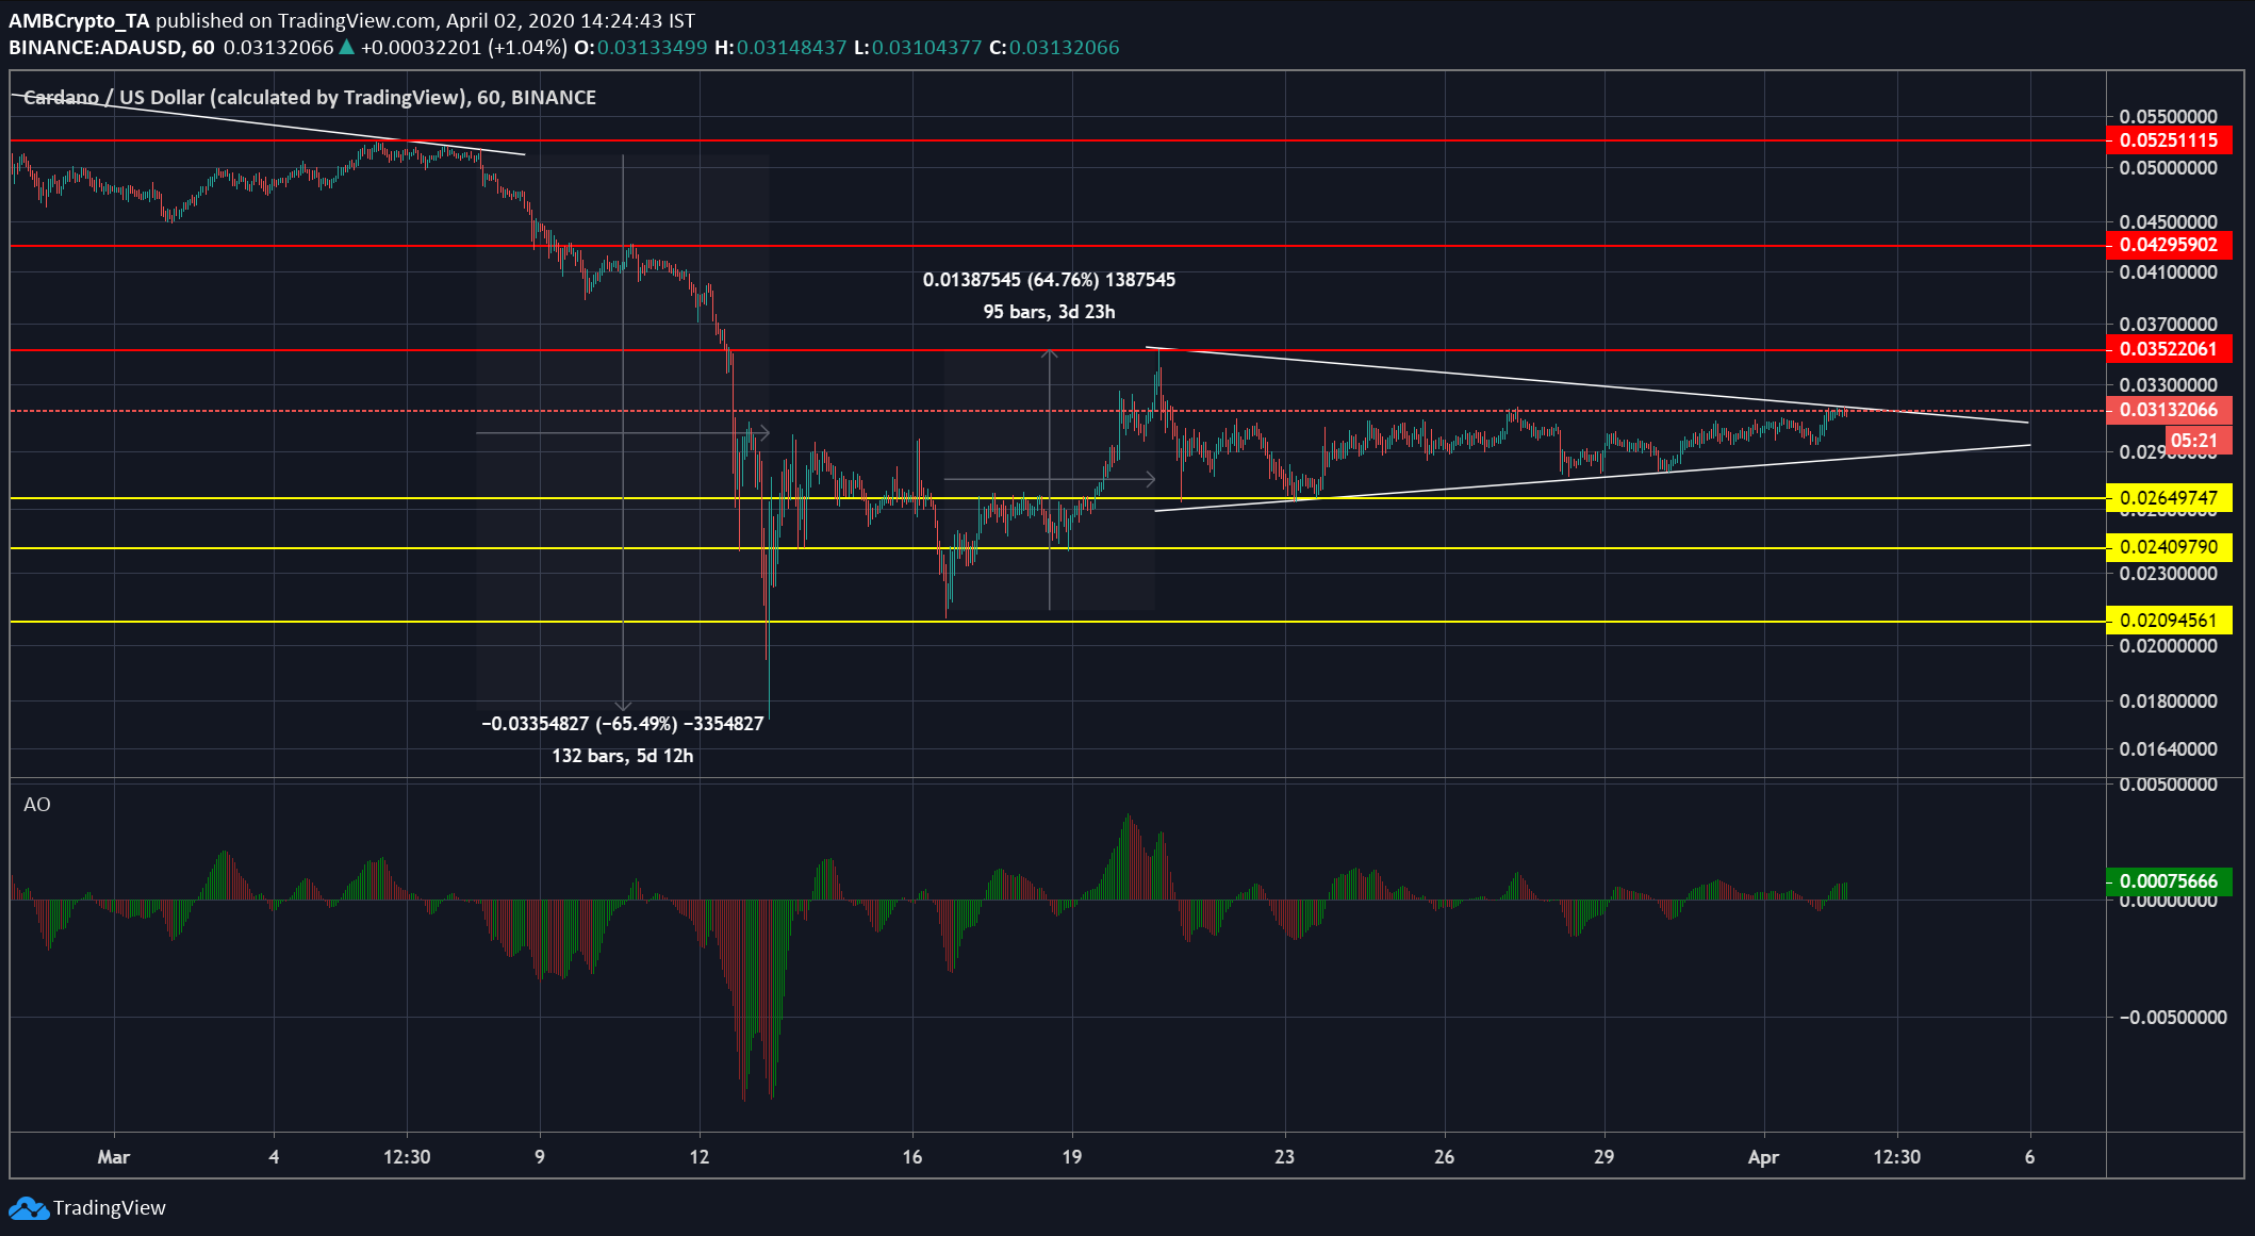
Cardano has been trending downwards since 13 February. The coin saw another major drop on 7 March [65% drop], a movement that continued following the market crash on 12 March. However, the coin rose up within 3 days by 64% and it has since, been maintaining the support at $0.02.
There is a symmetrical triangle pattern being formed in the above chart, a development that indicated that the price might break out in either an upward or downward direction. However, the Awesome Oscillator indicator resting above the zero line with green bars confirmed an upward breakout.
Resistance: $0.035, $0.042, $0.052
Support: $0.023,$0.024, $0.020
Press time price: $0.031
Market Cap: $812,468,085
24-hour Trading Volume: $93,928,506
ZB Token

Source: ZB Token/ USD, TradingView
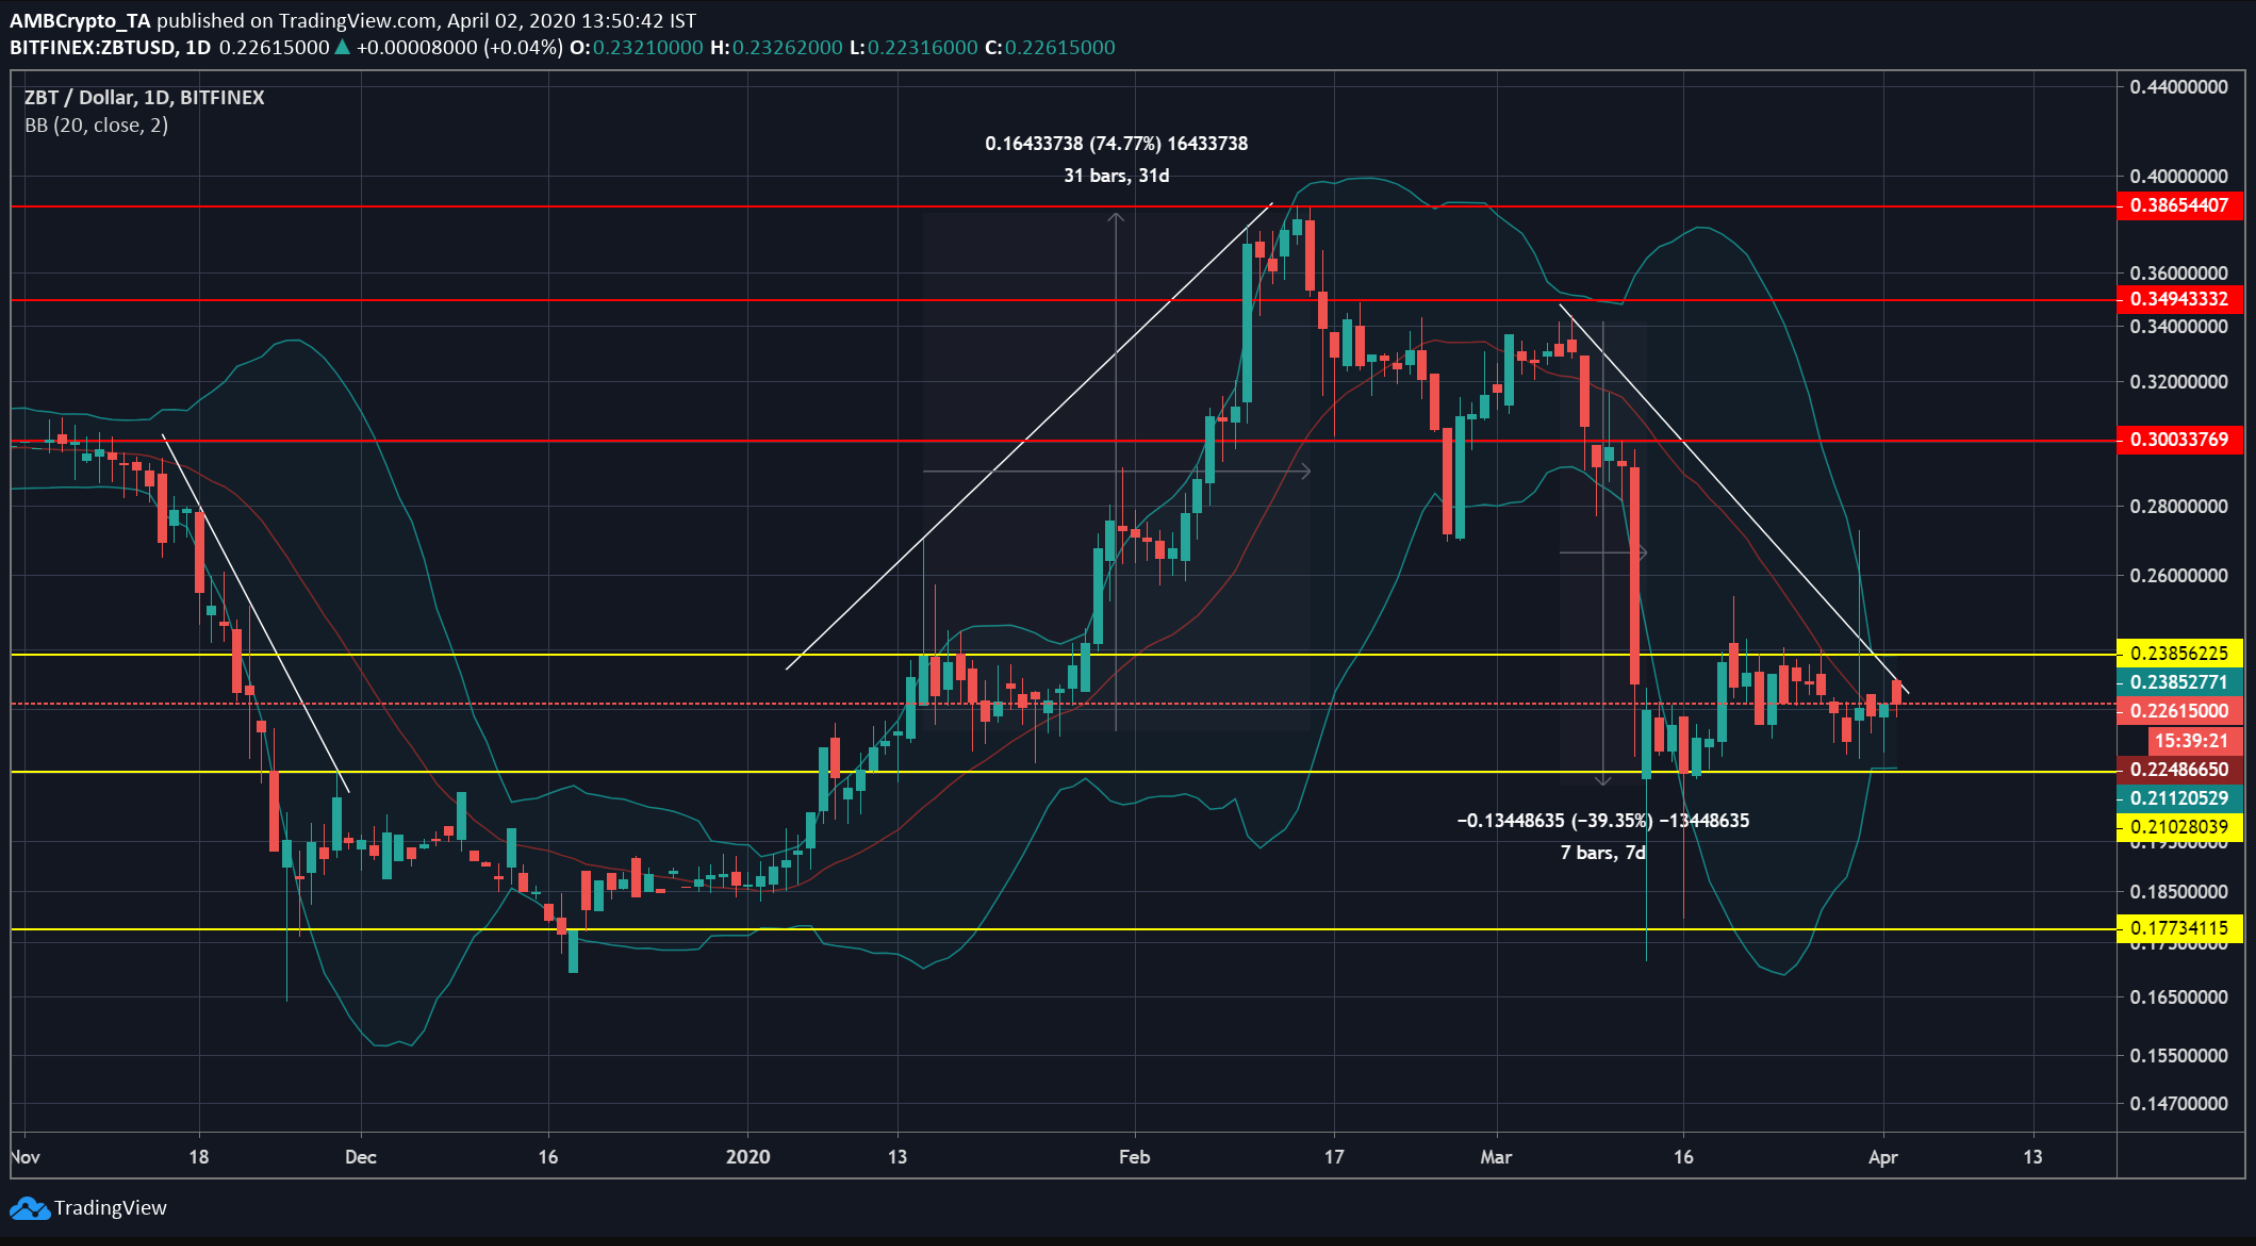
The 46th ranked coin on CoinMarketCap had a good start at the beginning of 2020. As seen in the chart above, there was an upward trend seen; however, following 12 March, the price has been on a downward run as it fell by 39% over a period of seven days. Furthermore, the Bollinger Bands appeared to be contracting, a sign that there might be lower volatility levels over the coming days.
Resistance: $0.30, $0.34, $0.38
Support: $0.23, $0.21, $0.17
Press time price: $0.226
Market Cap: $105,430,787 USD
24-hour Trading Volume: $26,208,469
Kyber Network

Source: Kyber Network price-volatility chart, lunarcrush
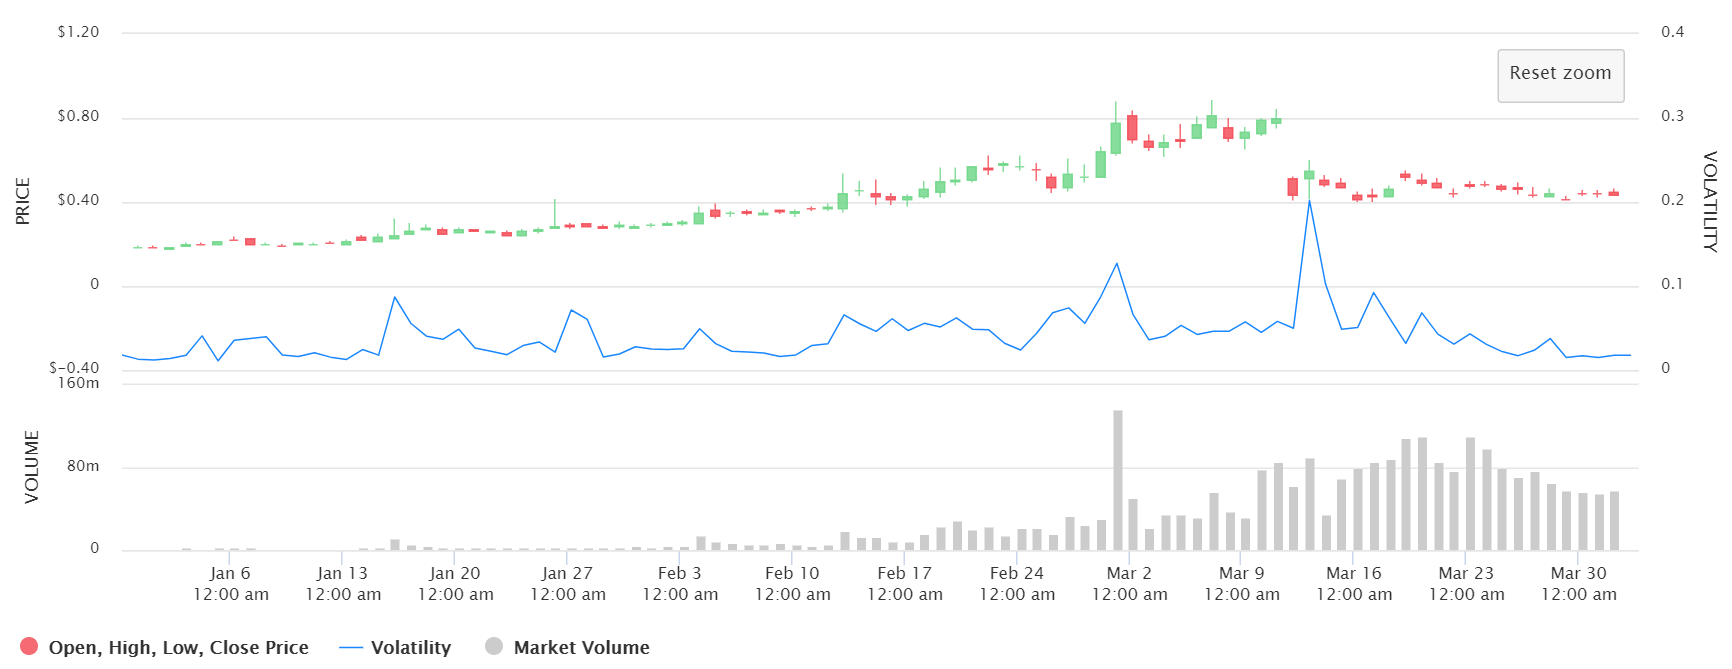
Kyber Network’s[KNC] price has been on the rise since the end of December 2019. The network also experienced significant growth in transaction volume, and this might be the pre-effect of the major protocol upgrade scheduled for Q2 of 2020. Looking at the above price v/s volatility chart, it can be seen that the price has been rising upwards since Jan 1, although it experienced a slight glitch post the crash. The volatility levels are also low. Investors seem to be believing in the long-term potential of KNC.
Press time price:$0.434452
Market Cap: $78,163,694
24-hour Trading Volume: $28,299,657


