Cardano, VeChain, Stellar Lumens Price Analysis: 30 October

Bearish market trends seemed to be supporting a period of sell-off in the three alts, Cardano, Stellar Lumens, and VeChain.
Moving averages favored a bearish trend for Cardano. Stellar Lumens too depicted a selling sentiment on its trading charts. Compound (COMP) displayed high levels of market volatility, which coincided with a period of a downtrend, hinting at a strong price action favoring the bears.
Cardano [ADA]

Source: ADA/USD on TradingView
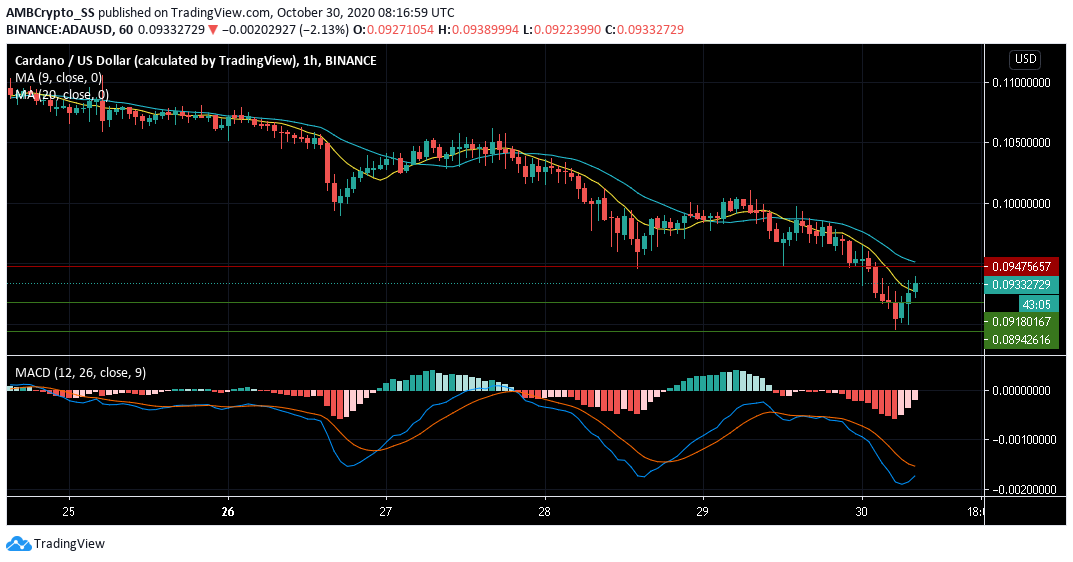
Since the last 24 hours, Cardano (ADA) had recorded a loss in valuation by almost 6% as it was pushed down towards the $0.089 level of support.
ADA further failed to maintain its price above the 9 and 20 period Simple Moving Averages, with the 9 SMA (yellow) seen diving below the 20 SMA (cyan) -a clear sign of bearish momentum.
Also, indicating a stronghold of the bears, a selling momentum was picked up on the MACD indicator.
However, the immediate uptick visible in the prices at press time, confirmed the possibility of a price reversal in the upcoming trading session. This was also hinted at, by the early signs of a trend reversal on the MACD, with the MACD line seen rising towards the signal line.
Stellar Lumens [XLM]

Source: XLM/USD on TradingView
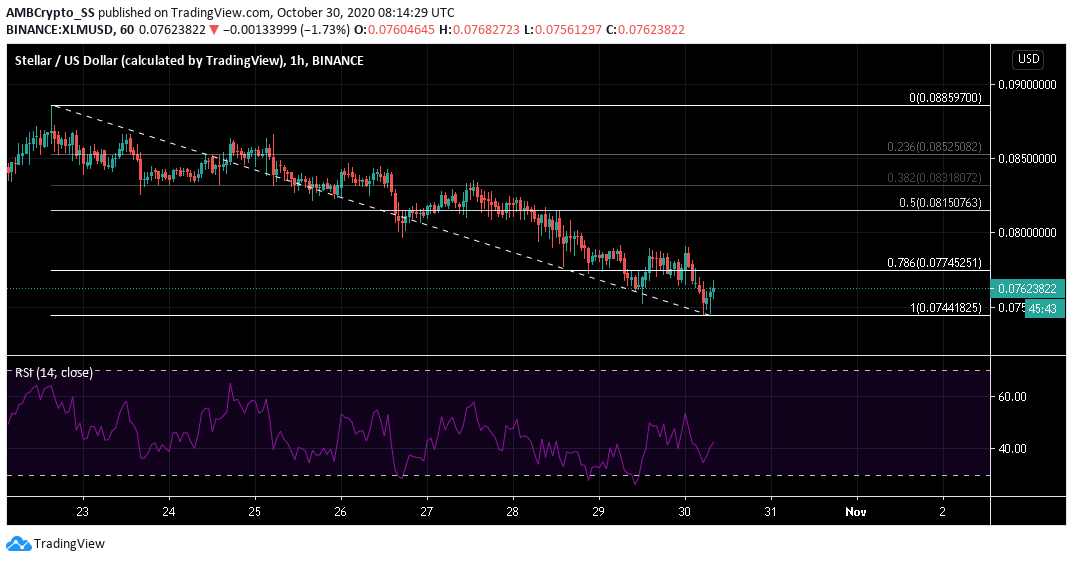
Stellar Lumens is down by a percent since yesterday, was seen trending lower, finding support at the 100% retracement region marked by the Fibonacci retracement tool.
The price chart displayed a clear trend of a descending channel forming, as further bearishness set in the XLM market.
After diving back down near the oversold territory, the Relative Strength Index (RSI), noted some buying pressure at press time, although still well below the 50-neutral zone.
Following the indications from the bearish dive towards the 100% retracement region and a weak buying pressure underlined by the RSI indicator, the likelihood of a further downtrend in the XLM market cannot be ruled out.
Vechain [VET]

Source: VET/USD on TradingView
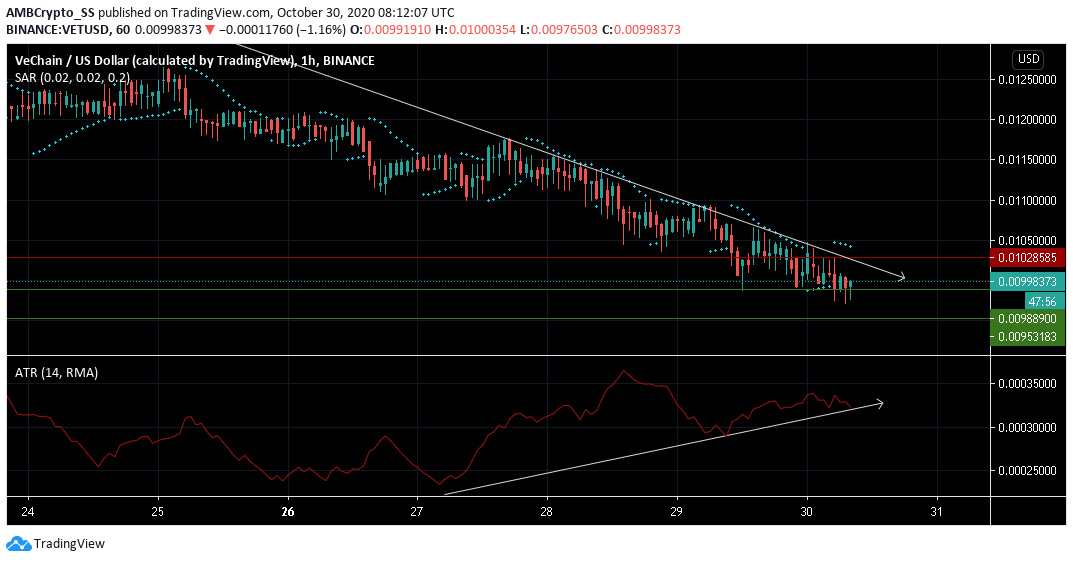
While the Average True Range noted a consistent rise in the levels of volatility over the past three days, a noticeable price correction of 10% was also witnessed during the same time period in the Vechain market.
This meant the high levels of market volatility also aided the bears’ downward price action.
Signaling a comeback of another wave of selling pressure, amid high volatility levels, the digital asset, in the last 24 hours, was pushed down a support turned resistance level at $0.010
The dotted lines of the Parabolic SAR above the candles also hinted towards a downward price trend for the upcoming trading sessions.


